Immigrants from Micronesia vs Immigrants from Taiwan 4th Grade
COMPARE
Immigrants from Micronesia
Immigrants from Taiwan
4th Grade
4th Grade Comparison
Immigrants from Micronesia
Immigrants from Taiwan
97.5%
4TH GRADE
49.6/ 100
METRIC RATING
175th/ 347
METRIC RANK
97.5%
4TH GRADE
41.5/ 100
METRIC RATING
181st/ 347
METRIC RANK
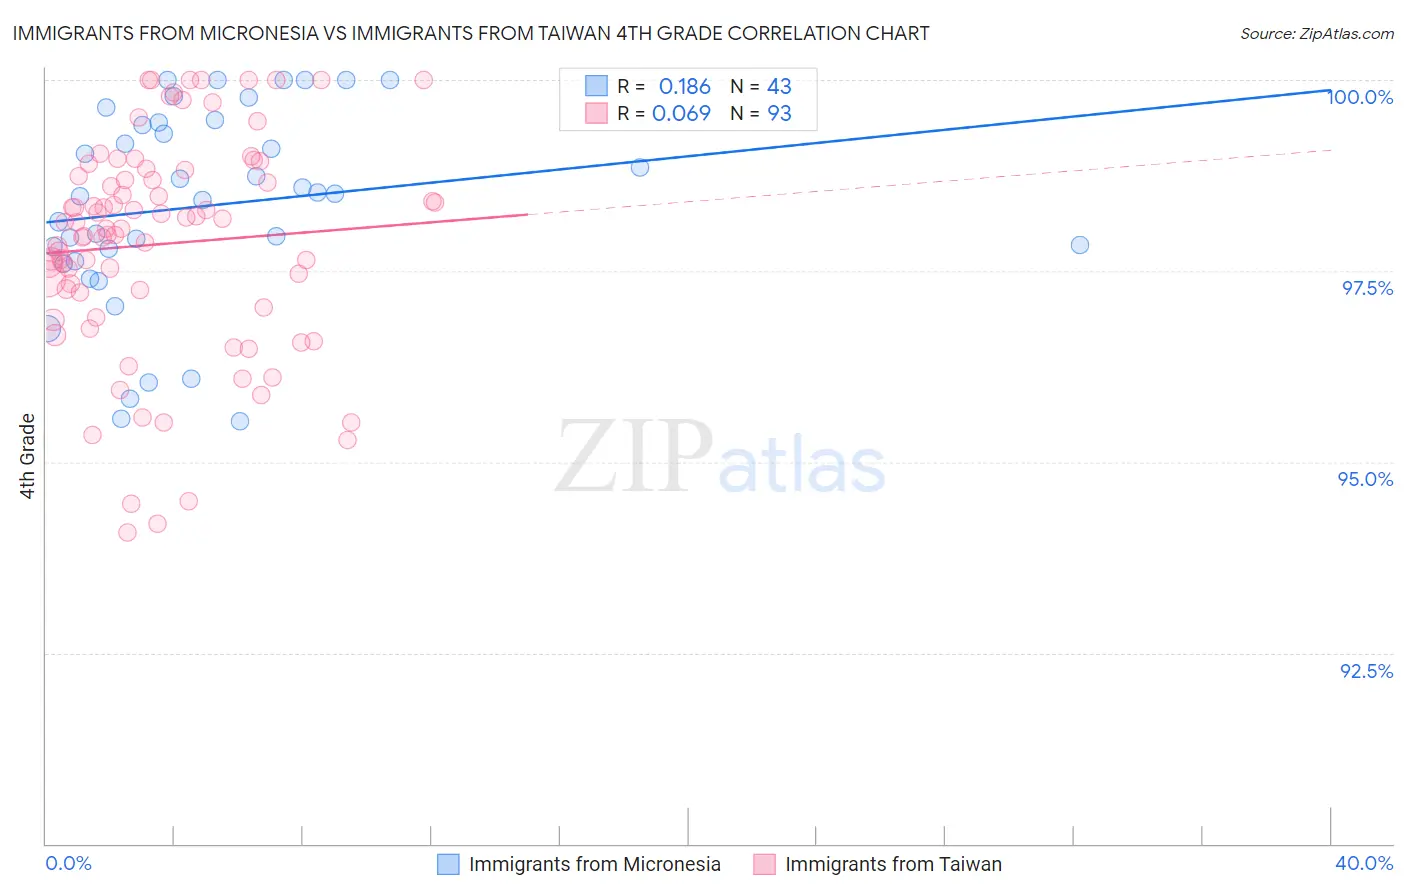
Immigrants from Micronesia vs Immigrants from Taiwan 4th Grade Correlation Chart
The statistical analysis conducted on geographies consisting of 61,604,657 people shows a poor positive correlation between the proportion of Immigrants from Micronesia and percentage of population with at least 4th grade education in the United States with a correlation coefficient (R) of 0.186 and weighted average of 97.5%. Similarly, the statistical analysis conducted on geographies consisting of 298,069,082 people shows a slight positive correlation between the proportion of Immigrants from Taiwan and percentage of population with at least 4th grade education in the United States with a correlation coefficient (R) of 0.069 and weighted average of 97.5%, a difference of 0.030%.
4th Grade Correlation Summary
| Measurement | Immigrants from Micronesia | Immigrants from Taiwan |
| Minimum | 95.5% | 94.1% |
| Maximum | 100.0% | 100.0% |
| Range | 4.5% | 5.9% |
| Mean | 98.4% | 97.9% |
| Median | 98.5% | 98.1% |
| Interquartile 25% (IQ1) | 97.6% | 97.1% |
| Interquartile 75% (IQ3) | 99.4% | 98.8% |
| Interquartile Range (IQR) | 1.8% | 1.7% |
| Standard Deviation (Sample) | 1.3% | 1.4% |
| Standard Deviation (Population) | 1.3% | 1.4% |
Demographics Similar to Immigrants from Micronesia and Immigrants from Taiwan by 4th Grade
In terms of 4th grade, the demographic groups most similar to Immigrants from Micronesia are Immigrants from Korea (97.5%, a difference of 0.0%), Egyptian (97.5%, a difference of 0.0%), Arab (97.5%, a difference of 0.0%), Immigrants from Spain (97.5%, a difference of 0.010%), and Brazilian (97.5%, a difference of 0.010%). Similarly, the demographic groups most similar to Immigrants from Taiwan are Immigrants from Venezuela (97.5%, a difference of 0.0%), Comanche (97.5%, a difference of 0.010%), Immigrants from Kazakhstan (97.5%, a difference of 0.010%), Spanish American (97.5%, a difference of 0.010%), and Argentinean (97.5%, a difference of 0.010%).
| Demographics | Rating | Rank | 4th Grade |
| Immigrants | Belarus | 55.8 /100 | #168 | Average 97.5% |
| Chileans | 54.4 /100 | #169 | Average 97.5% |
| Immigrants | Spain | 51.8 /100 | #170 | Average 97.5% |
| Brazilians | 51.5 /100 | #171 | Average 97.5% |
| Immigrants | Sri Lanka | 51.1 /100 | #172 | Average 97.5% |
| Immigrants | Korea | 50.6 /100 | #173 | Average 97.5% |
| Egyptians | 50.0 /100 | #174 | Average 97.5% |
| Immigrants | Micronesia | 49.6 /100 | #175 | Average 97.5% |
| Arabs | 48.7 /100 | #176 | Average 97.5% |
| Immigrants | Brazil | 46.1 /100 | #177 | Average 97.5% |
| Comanche | 45.3 /100 | #178 | Average 97.5% |
| Immigrants | Kazakhstan | 43.6 /100 | #179 | Average 97.5% |
| Immigrants | Venezuela | 42.7 /100 | #180 | Average 97.5% |
| Immigrants | Taiwan | 41.5 /100 | #181 | Average 97.5% |
| Spanish Americans | 39.3 /100 | #182 | Fair 97.5% |
| Argentineans | 39.0 /100 | #183 | Fair 97.5% |
| Pakistanis | 36.2 /100 | #184 | Fair 97.5% |
| Immigrants | Kenya | 35.8 /100 | #185 | Fair 97.5% |
| Dutch West Indians | 35.8 /100 | #186 | Fair 97.5% |
| Mongolians | 34.7 /100 | #187 | Fair 97.5% |
| Immigrants | Argentina | 34.6 /100 | #188 | Fair 97.5% |