Immigrants from Micronesia vs Kiowa 4th Grade
COMPARE
Immigrants from Micronesia
Kiowa
4th Grade
4th Grade Comparison
Immigrants from Micronesia
Kiowa
97.5%
4TH GRADE
49.6/ 100
METRIC RATING
175th/ 347
METRIC RANK
98.0%
4TH GRADE
99.6/ 100
METRIC RATING
68th/ 347
METRIC RANK
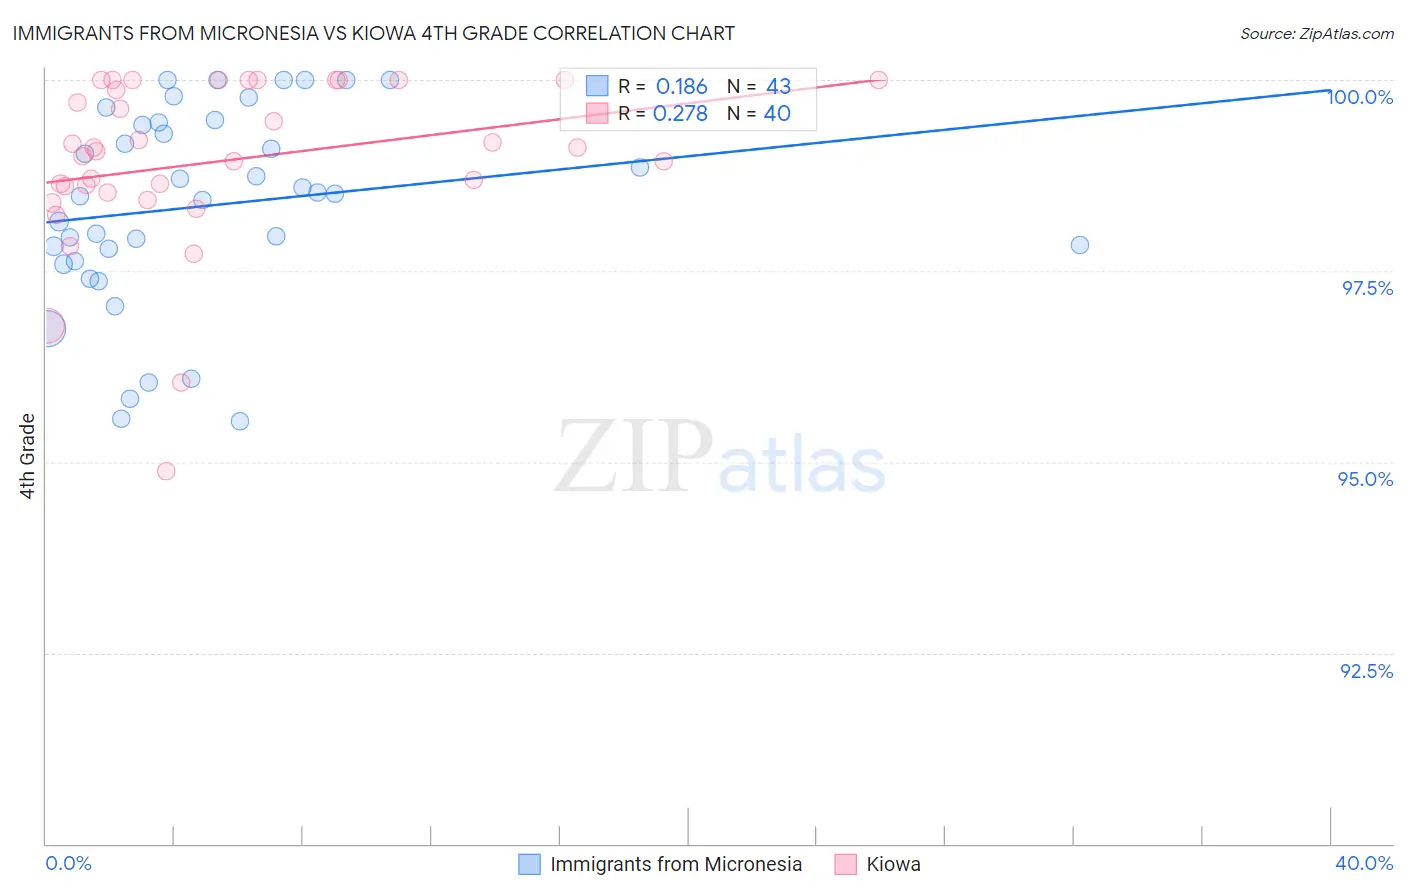
Immigrants from Micronesia vs Kiowa 4th Grade Correlation Chart
The statistical analysis conducted on geographies consisting of 61,604,657 people shows a poor positive correlation between the proportion of Immigrants from Micronesia and percentage of population with at least 4th grade education in the United States with a correlation coefficient (R) of 0.186 and weighted average of 97.5%. Similarly, the statistical analysis conducted on geographies consisting of 56,100,633 people shows a weak positive correlation between the proportion of Kiowa and percentage of population with at least 4th grade education in the United States with a correlation coefficient (R) of 0.278 and weighted average of 98.0%, a difference of 0.52%.
4th Grade Correlation Summary
| Measurement | Immigrants from Micronesia | Kiowa |
| Minimum | 95.5% | 94.9% |
| Maximum | 100.0% | 100.0% |
| Range | 4.5% | 5.1% |
| Mean | 98.4% | 98.9% |
| Median | 98.5% | 99.1% |
| Interquartile 25% (IQ1) | 97.6% | 98.6% |
| Interquartile 75% (IQ3) | 99.4% | 100.0% |
| Interquartile Range (IQR) | 1.8% | 1.4% |
| Standard Deviation (Sample) | 1.3% | 1.1% |
| Standard Deviation (Population) | 1.3% | 1.1% |
Similar Demographics by 4th Grade
Demographics Similar to Immigrants from Micronesia by 4th Grade
In terms of 4th grade, the demographic groups most similar to Immigrants from Micronesia are Immigrants from Korea (97.5%, a difference of 0.0%), Egyptian (97.5%, a difference of 0.0%), Arab (97.5%, a difference of 0.0%), Immigrants from Spain (97.5%, a difference of 0.010%), and Brazilian (97.5%, a difference of 0.010%).
| Demographics | Rating | Rank | 4th Grade |
| Immigrants | Belarus | 55.8 /100 | #168 | Average 97.5% |
| Chileans | 54.4 /100 | #169 | Average 97.5% |
| Immigrants | Spain | 51.8 /100 | #170 | Average 97.5% |
| Brazilians | 51.5 /100 | #171 | Average 97.5% |
| Immigrants | Sri Lanka | 51.1 /100 | #172 | Average 97.5% |
| Immigrants | Korea | 50.6 /100 | #173 | Average 97.5% |
| Egyptians | 50.0 /100 | #174 | Average 97.5% |
| Immigrants | Micronesia | 49.6 /100 | #175 | Average 97.5% |
| Arabs | 48.7 /100 | #176 | Average 97.5% |
| Immigrants | Brazil | 46.1 /100 | #177 | Average 97.5% |
| Comanche | 45.3 /100 | #178 | Average 97.5% |
| Immigrants | Kazakhstan | 43.6 /100 | #179 | Average 97.5% |
| Immigrants | Venezuela | 42.7 /100 | #180 | Average 97.5% |
| Immigrants | Taiwan | 41.5 /100 | #181 | Average 97.5% |
| Spanish Americans | 39.3 /100 | #182 | Fair 97.5% |
Demographics Similar to Kiowa by 4th Grade
In terms of 4th grade, the demographic groups most similar to Kiowa are Pueblo (98.0%, a difference of 0.0%), Immigrants from Austria (98.0%, a difference of 0.0%), Lumbee (98.0%, a difference of 0.0%), Cajun (98.0%, a difference of 0.010%), and Immigrants from Northern Europe (98.0%, a difference of 0.010%).
| Demographics | Rating | Rank | 4th Grade |
| Immigrants | North America | 99.7 /100 | #61 | Exceptional 98.1% |
| Serbians | 99.7 /100 | #62 | Exceptional 98.1% |
| Russians | 99.7 /100 | #63 | Exceptional 98.0% |
| Cajuns | 99.7 /100 | #64 | Exceptional 98.0% |
| Immigrants | Northern Europe | 99.6 /100 | #65 | Exceptional 98.0% |
| Canadians | 99.6 /100 | #66 | Exceptional 98.0% |
| New Zealanders | 99.6 /100 | #67 | Exceptional 98.0% |
| Kiowa | 99.6 /100 | #68 | Exceptional 98.0% |
| Pueblo | 99.6 /100 | #69 | Exceptional 98.0% |
| Immigrants | Austria | 99.6 /100 | #70 | Exceptional 98.0% |
| Lumbee | 99.6 /100 | #71 | Exceptional 98.0% |
| Iranians | 99.4 /100 | #72 | Exceptional 98.0% |
| Macedonians | 99.4 /100 | #73 | Exceptional 98.0% |
| Chickasaw | 99.4 /100 | #74 | Exceptional 98.0% |
| Immigrants | Netherlands | 99.3 /100 | #75 | Exceptional 98.0% |