Creek vs Immigrants from Taiwan 4th Grade
COMPARE
Creek
Immigrants from Taiwan
4th Grade
4th Grade Comparison
Creek
Immigrants from Taiwan
98.1%
4TH GRADE
99.8/ 100
METRIC RATING
58th/ 347
METRIC RANK
97.5%
4TH GRADE
41.5/ 100
METRIC RATING
181st/ 347
METRIC RANK
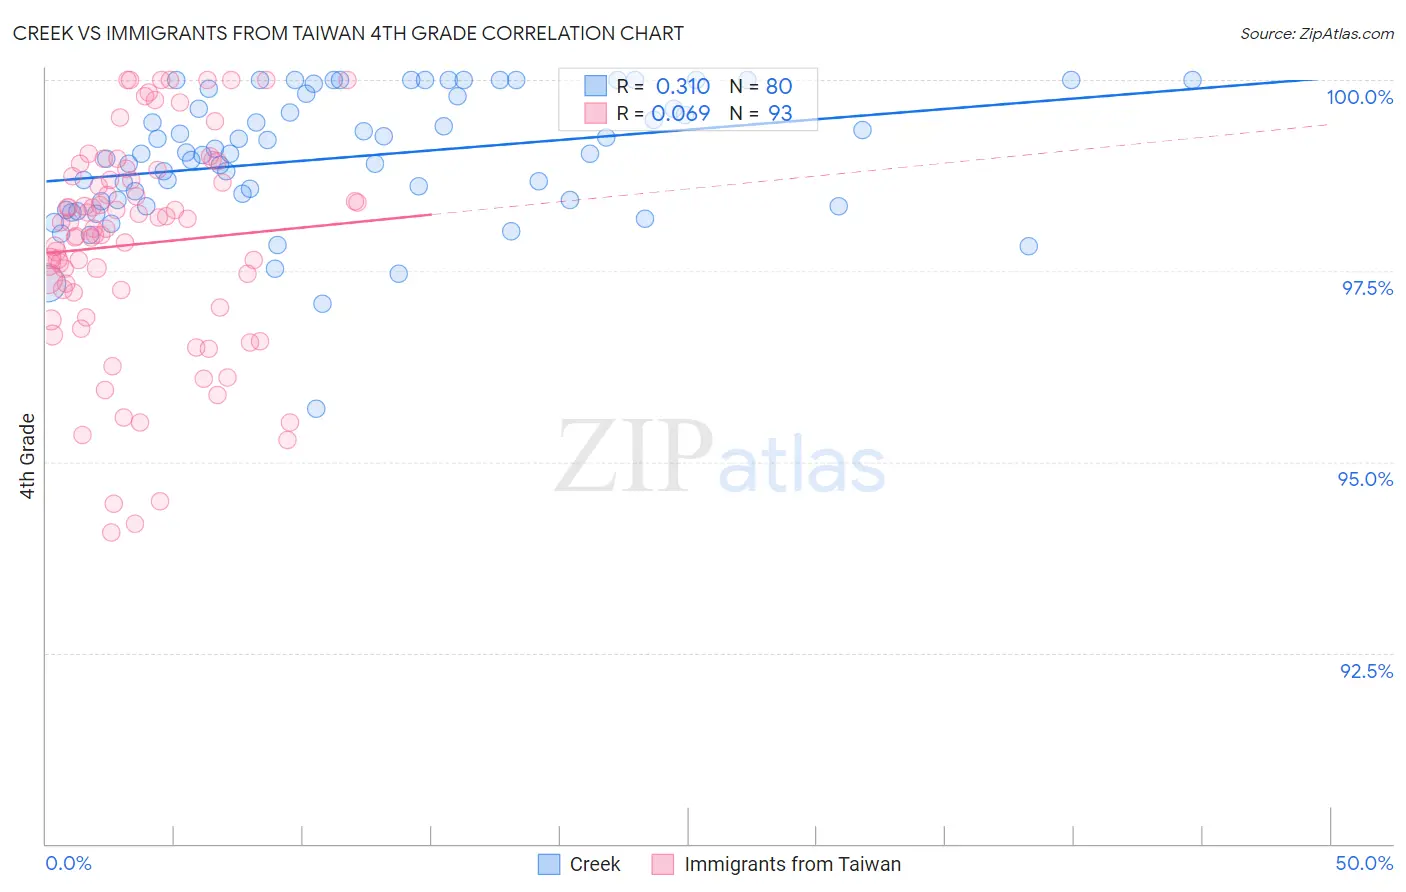
Creek vs Immigrants from Taiwan 4th Grade Correlation Chart
The statistical analysis conducted on geographies consisting of 178,480,663 people shows a mild positive correlation between the proportion of Creek and percentage of population with at least 4th grade education in the United States with a correlation coefficient (R) of 0.310 and weighted average of 98.1%. Similarly, the statistical analysis conducted on geographies consisting of 298,069,082 people shows a slight positive correlation between the proportion of Immigrants from Taiwan and percentage of population with at least 4th grade education in the United States with a correlation coefficient (R) of 0.069 and weighted average of 97.5%, a difference of 0.61%.
4th Grade Correlation Summary
| Measurement | Creek | Immigrants from Taiwan |
| Minimum | 95.7% | 94.1% |
| Maximum | 100.0% | 100.0% |
| Range | 4.3% | 5.9% |
| Mean | 99.0% | 97.9% |
| Median | 99.0% | 98.1% |
| Interquartile 25% (IQ1) | 98.4% | 97.1% |
| Interquartile 75% (IQ3) | 99.8% | 98.8% |
| Interquartile Range (IQR) | 1.4% | 1.7% |
| Standard Deviation (Sample) | 0.86% | 1.4% |
| Standard Deviation (Population) | 0.85% | 1.4% |
Similar Demographics by 4th Grade
Demographics Similar to Creek by 4th Grade
In terms of 4th grade, the demographic groups most similar to Creek are Greek (98.1%, a difference of 0.0%), Austrian (98.1%, a difference of 0.0%), Australian (98.1%, a difference of 0.010%), Slavic (98.1%, a difference of 0.010%), and Maltese (98.1%, a difference of 0.010%).
| Demographics | Rating | Rank | 4th Grade |
| Celtics | 99.8 /100 | #51 | Exceptional 98.1% |
| Australians | 99.8 /100 | #52 | Exceptional 98.1% |
| Slavs | 99.8 /100 | #53 | Exceptional 98.1% |
| Maltese | 99.8 /100 | #54 | Exceptional 98.1% |
| Whites/Caucasians | 99.8 /100 | #55 | Exceptional 98.1% |
| Greeks | 99.8 /100 | #56 | Exceptional 98.1% |
| Austrians | 99.8 /100 | #57 | Exceptional 98.1% |
| Creek | 99.8 /100 | #58 | Exceptional 98.1% |
| Americans | 99.8 /100 | #59 | Exceptional 98.1% |
| Immigrants | Canada | 99.7 /100 | #60 | Exceptional 98.1% |
| Immigrants | North America | 99.7 /100 | #61 | Exceptional 98.1% |
| Serbians | 99.7 /100 | #62 | Exceptional 98.1% |
| Russians | 99.7 /100 | #63 | Exceptional 98.0% |
| Cajuns | 99.7 /100 | #64 | Exceptional 98.0% |
| Immigrants | Northern Europe | 99.6 /100 | #65 | Exceptional 98.0% |
Demographics Similar to Immigrants from Taiwan by 4th Grade
In terms of 4th grade, the demographic groups most similar to Immigrants from Taiwan are Immigrants from Venezuela (97.5%, a difference of 0.0%), Comanche (97.5%, a difference of 0.010%), Immigrants from Kazakhstan (97.5%, a difference of 0.010%), Spanish American (97.5%, a difference of 0.010%), and Argentinean (97.5%, a difference of 0.010%).
| Demographics | Rating | Rank | 4th Grade |
| Egyptians | 50.0 /100 | #174 | Average 97.5% |
| Immigrants | Micronesia | 49.6 /100 | #175 | Average 97.5% |
| Arabs | 48.7 /100 | #176 | Average 97.5% |
| Immigrants | Brazil | 46.1 /100 | #177 | Average 97.5% |
| Comanche | 45.3 /100 | #178 | Average 97.5% |
| Immigrants | Kazakhstan | 43.6 /100 | #179 | Average 97.5% |
| Immigrants | Venezuela | 42.7 /100 | #180 | Average 97.5% |
| Immigrants | Taiwan | 41.5 /100 | #181 | Average 97.5% |
| Spanish Americans | 39.3 /100 | #182 | Fair 97.5% |
| Argentineans | 39.0 /100 | #183 | Fair 97.5% |
| Pakistanis | 36.2 /100 | #184 | Fair 97.5% |
| Immigrants | Kenya | 35.8 /100 | #185 | Fair 97.5% |
| Dutch West Indians | 35.8 /100 | #186 | Fair 97.5% |
| Mongolians | 34.7 /100 | #187 | Fair 97.5% |
| Immigrants | Argentina | 34.6 /100 | #188 | Fair 97.5% |