Immigrants from Malaysia vs Immigrants from North Macedonia Nursery School
COMPARE
Immigrants from Malaysia
Immigrants from North Macedonia
Nursery School
Nursery School Comparison
Immigrants from Malaysia
Immigrants from North Macedonia
97.7%
NURSERY SCHOOL
1.9/ 100
METRIC RATING
236th/ 347
METRIC RANK
98.0%
NURSERY SCHOOL
65.7/ 100
METRIC RATING
158th/ 347
METRIC RANK
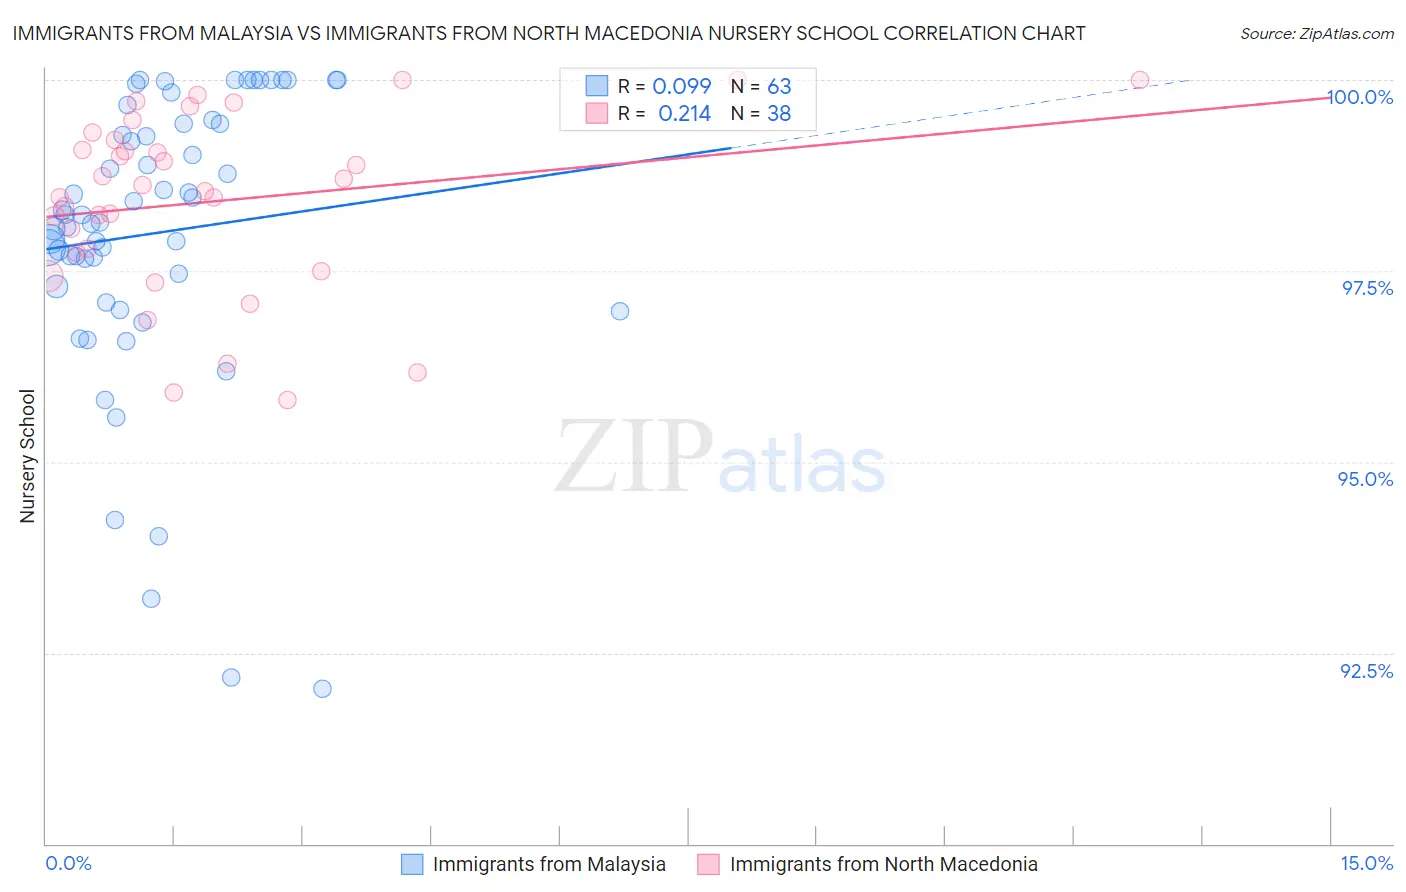
Immigrants from Malaysia vs Immigrants from North Macedonia Nursery School Correlation Chart
The statistical analysis conducted on geographies consisting of 197,973,709 people shows a slight positive correlation between the proportion of Immigrants from Malaysia and percentage of population with at least nursery school education in the United States with a correlation coefficient (R) of 0.099 and weighted average of 97.7%. Similarly, the statistical analysis conducted on geographies consisting of 74,317,186 people shows a weak positive correlation between the proportion of Immigrants from North Macedonia and percentage of population with at least nursery school education in the United States with a correlation coefficient (R) of 0.214 and weighted average of 98.0%, a difference of 0.34%.
Nursery School Correlation Summary
| Measurement | Immigrants from Malaysia | Immigrants from North Macedonia |
| Minimum | 92.0% | 95.8% |
| Maximum | 100.0% | 100.0% |
| Range | 8.0% | 4.2% |
| Mean | 98.0% | 98.4% |
| Median | 98.2% | 98.6% |
| Interquartile 25% (IQ1) | 97.3% | 97.7% |
| Interquartile 75% (IQ3) | 99.4% | 99.2% |
| Interquartile Range (IQR) | 2.1% | 1.5% |
| Standard Deviation (Sample) | 1.9% | 1.2% |
| Standard Deviation (Population) | 1.9% | 1.1% |
Similar Demographics by Nursery School
Demographics Similar to Immigrants from Malaysia by Nursery School
In terms of nursery school, the demographic groups most similar to Immigrants from Malaysia are Immigrants from Western Asia (97.7%, a difference of 0.0%), Immigrants from Uruguay (97.7%, a difference of 0.010%), U.S. Virgin Islander (97.7%, a difference of 0.010%), Colombian (97.7%, a difference of 0.010%), and Immigrants from Pakistan (97.7%, a difference of 0.010%).
| Demographics | Rating | Rank | Nursery School |
| Senegalese | 3.2 /100 | #229 | Tragic 97.7% |
| Sierra Leoneans | 2.9 /100 | #230 | Tragic 97.7% |
| Puerto Ricans | 2.6 /100 | #231 | Tragic 97.7% |
| Immigrants | Uruguay | 2.3 /100 | #232 | Tragic 97.7% |
| U.S. Virgin Islanders | 2.1 /100 | #233 | Tragic 97.7% |
| Colombians | 2.1 /100 | #234 | Tragic 97.7% |
| Immigrants | Pakistan | 2.1 /100 | #235 | Tragic 97.7% |
| Immigrants | Malaysia | 1.9 /100 | #236 | Tragic 97.7% |
| Immigrants | Western Asia | 1.9 /100 | #237 | Tragic 97.7% |
| Nigerians | 1.7 /100 | #238 | Tragic 97.7% |
| Immigrants | Eastern Asia | 1.6 /100 | #239 | Tragic 97.7% |
| Koreans | 1.4 /100 | #240 | Tragic 97.7% |
| Immigrants | Indonesia | 1.1 /100 | #241 | Tragic 97.7% |
| Liberians | 1.1 /100 | #242 | Tragic 97.7% |
| Asians | 1.1 /100 | #243 | Tragic 97.6% |
Demographics Similar to Immigrants from North Macedonia by Nursery School
In terms of nursery school, the demographic groups most similar to Immigrants from North Macedonia are Immigrants from South Central Asia (98.0%, a difference of 0.0%), Venezuelan (98.0%, a difference of 0.0%), Comanche (98.0%, a difference of 0.0%), Immigrants from Moldova (98.0%, a difference of 0.010%), and Immigrants from Iran (98.0%, a difference of 0.010%).
| Demographics | Rating | Rank | Nursery School |
| Soviet Union | 71.6 /100 | #151 | Good 98.0% |
| Dutch West Indians | 70.2 /100 | #152 | Good 98.0% |
| Immigrants | Moldova | 69.6 /100 | #153 | Good 98.0% |
| Immigrants | Iran | 68.7 /100 | #154 | Good 98.0% |
| Immigrants | South Central Asia | 66.7 /100 | #155 | Good 98.0% |
| Venezuelans | 66.6 /100 | #156 | Good 98.0% |
| Comanche | 66.0 /100 | #157 | Good 98.0% |
| Immigrants | North Macedonia | 65.7 /100 | #158 | Good 98.0% |
| French American Indians | 62.1 /100 | #159 | Good 98.0% |
| Immigrants | Russia | 59.9 /100 | #160 | Average 98.0% |
| Immigrants | Eastern Europe | 59.7 /100 | #161 | Average 98.0% |
| Brazilians | 59.4 /100 | #162 | Average 98.0% |
| Immigrants | Italy | 59.0 /100 | #163 | Average 98.0% |
| Ugandans | 56.4 /100 | #164 | Average 98.0% |
| Chileans | 56.4 /100 | #165 | Average 98.0% |