Immigrants from Malaysia vs Immigrants from Syria Nursery School
COMPARE
Immigrants from Malaysia
Immigrants from Syria
Nursery School
Nursery School Comparison
Immigrants from Malaysia
Immigrants from Syria
97.7%
NURSERY SCHOOL
1.9/ 100
METRIC RATING
236th/ 347
METRIC RANK
97.7%
NURSERY SCHOOL
4.0/ 100
METRIC RATING
222nd/ 347
METRIC RANK
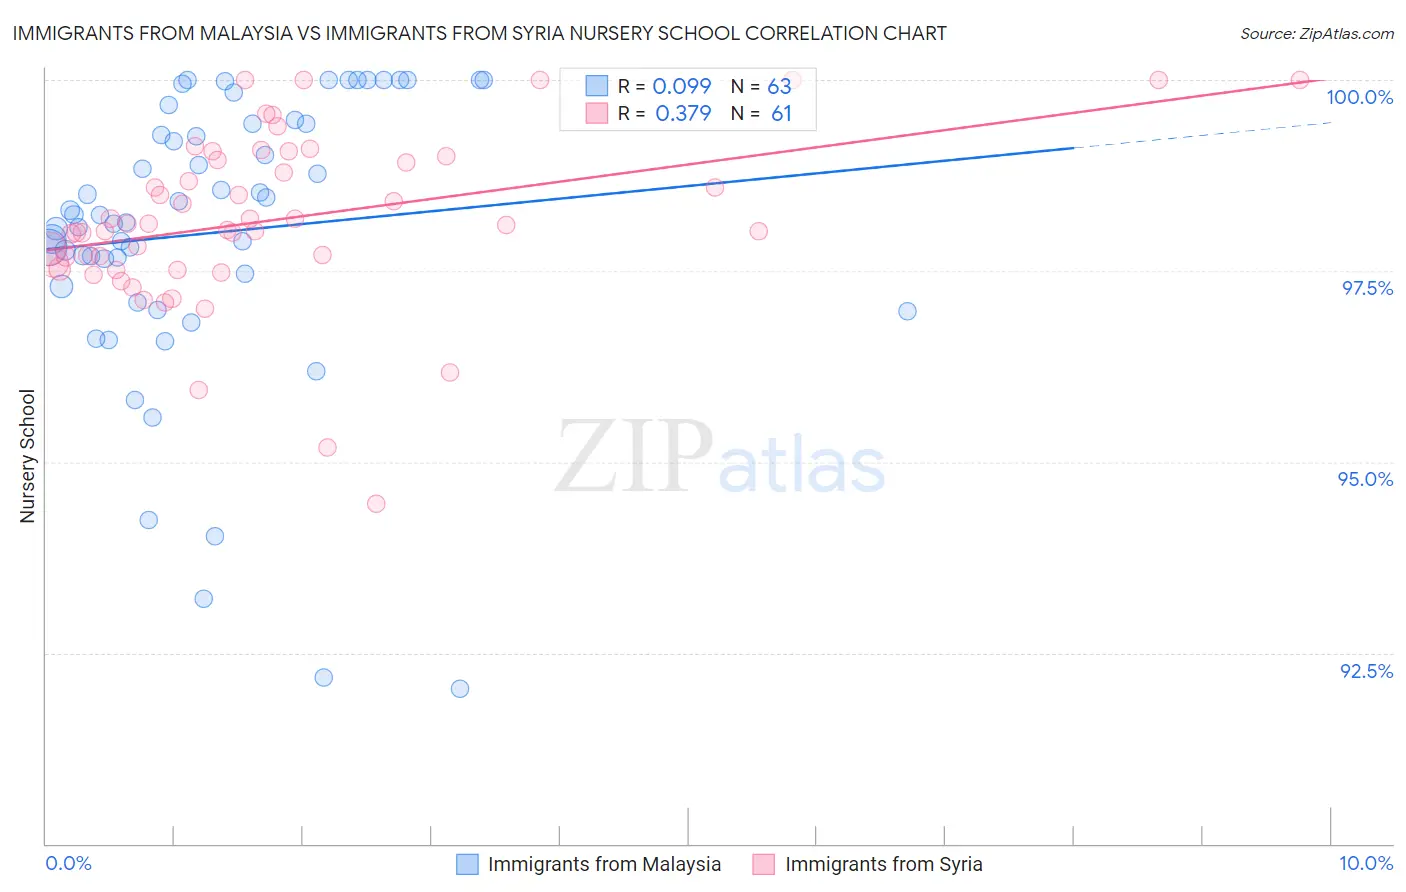
Immigrants from Malaysia vs Immigrants from Syria Nursery School Correlation Chart
The statistical analysis conducted on geographies consisting of 197,973,709 people shows a slight positive correlation between the proportion of Immigrants from Malaysia and percentage of population with at least nursery school education in the United States with a correlation coefficient (R) of 0.099 and weighted average of 97.7%. Similarly, the statistical analysis conducted on geographies consisting of 174,108,882 people shows a mild positive correlation between the proportion of Immigrants from Syria and percentage of population with at least nursery school education in the United States with a correlation coefficient (R) of 0.379 and weighted average of 97.7%, a difference of 0.050%.
Nursery School Correlation Summary
| Measurement | Immigrants from Malaysia | Immigrants from Syria |
| Minimum | 92.0% | 94.4% |
| Maximum | 100.0% | 100.0% |
| Range | 8.0% | 5.6% |
| Mean | 98.0% | 98.2% |
| Median | 98.2% | 98.1% |
| Interquartile 25% (IQ1) | 97.3% | 97.6% |
| Interquartile 75% (IQ3) | 99.4% | 99.0% |
| Interquartile Range (IQR) | 2.1% | 1.4% |
| Standard Deviation (Sample) | 1.9% | 1.1% |
| Standard Deviation (Population) | 1.9% | 1.1% |
Demographics Similar to Immigrants from Malaysia and Immigrants from Syria by Nursery School
In terms of nursery school, the demographic groups most similar to Immigrants from Malaysia are Immigrants from Western Asia (97.7%, a difference of 0.0%), Immigrants from Uruguay (97.7%, a difference of 0.010%), U.S. Virgin Islander (97.7%, a difference of 0.010%), Colombian (97.7%, a difference of 0.010%), and Immigrants from Pakistan (97.7%, a difference of 0.010%). Similarly, the demographic groups most similar to Immigrants from Syria are Immigrants from Sudan (97.7%, a difference of 0.0%), Immigrants from Zaire (97.8%, a difference of 0.010%), Tongan (97.8%, a difference of 0.010%), Immigrants from Nepal (97.7%, a difference of 0.010%), and Immigrants from Costa Rica (97.7%, a difference of 0.010%).
| Demographics | Rating | Rank | Nursery School |
| Immigrants | Morocco | 5.1 /100 | #219 | Tragic 97.8% |
| Immigrants | Zaire | 4.4 /100 | #220 | Tragic 97.8% |
| Tongans | 4.3 /100 | #221 | Tragic 97.8% |
| Immigrants | Syria | 4.0 /100 | #222 | Tragic 97.7% |
| Immigrants | Sudan | 3.9 /100 | #223 | Tragic 97.7% |
| Immigrants | Nepal | 3.6 /100 | #224 | Tragic 97.7% |
| Immigrants | Costa Rica | 3.5 /100 | #225 | Tragic 97.7% |
| Iraqis | 3.5 /100 | #226 | Tragic 97.7% |
| Sub-Saharan Africans | 3.2 /100 | #227 | Tragic 97.7% |
| Sudanese | 3.2 /100 | #228 | Tragic 97.7% |
| Senegalese | 3.2 /100 | #229 | Tragic 97.7% |
| Sierra Leoneans | 2.9 /100 | #230 | Tragic 97.7% |
| Puerto Ricans | 2.6 /100 | #231 | Tragic 97.7% |
| Immigrants | Uruguay | 2.3 /100 | #232 | Tragic 97.7% |
| U.S. Virgin Islanders | 2.1 /100 | #233 | Tragic 97.7% |
| Colombians | 2.1 /100 | #234 | Tragic 97.7% |
| Immigrants | Pakistan | 2.1 /100 | #235 | Tragic 97.7% |
| Immigrants | Malaysia | 1.9 /100 | #236 | Tragic 97.7% |
| Immigrants | Western Asia | 1.9 /100 | #237 | Tragic 97.7% |
| Nigerians | 1.7 /100 | #238 | Tragic 97.7% |
| Immigrants | Eastern Asia | 1.6 /100 | #239 | Tragic 97.7% |