Immigrants from Bangladesh vs Austrian 9th Grade
COMPARE
Immigrants from Bangladesh
Austrian
9th Grade
9th Grade Comparison
Immigrants from Bangladesh
Austrians
92.4%
9TH GRADE
0.0/ 100
METRIC RATING
309th/ 347
METRIC RANK
96.0%
9TH GRADE
99.8/ 100
METRIC RATING
53rd/ 347
METRIC RANK
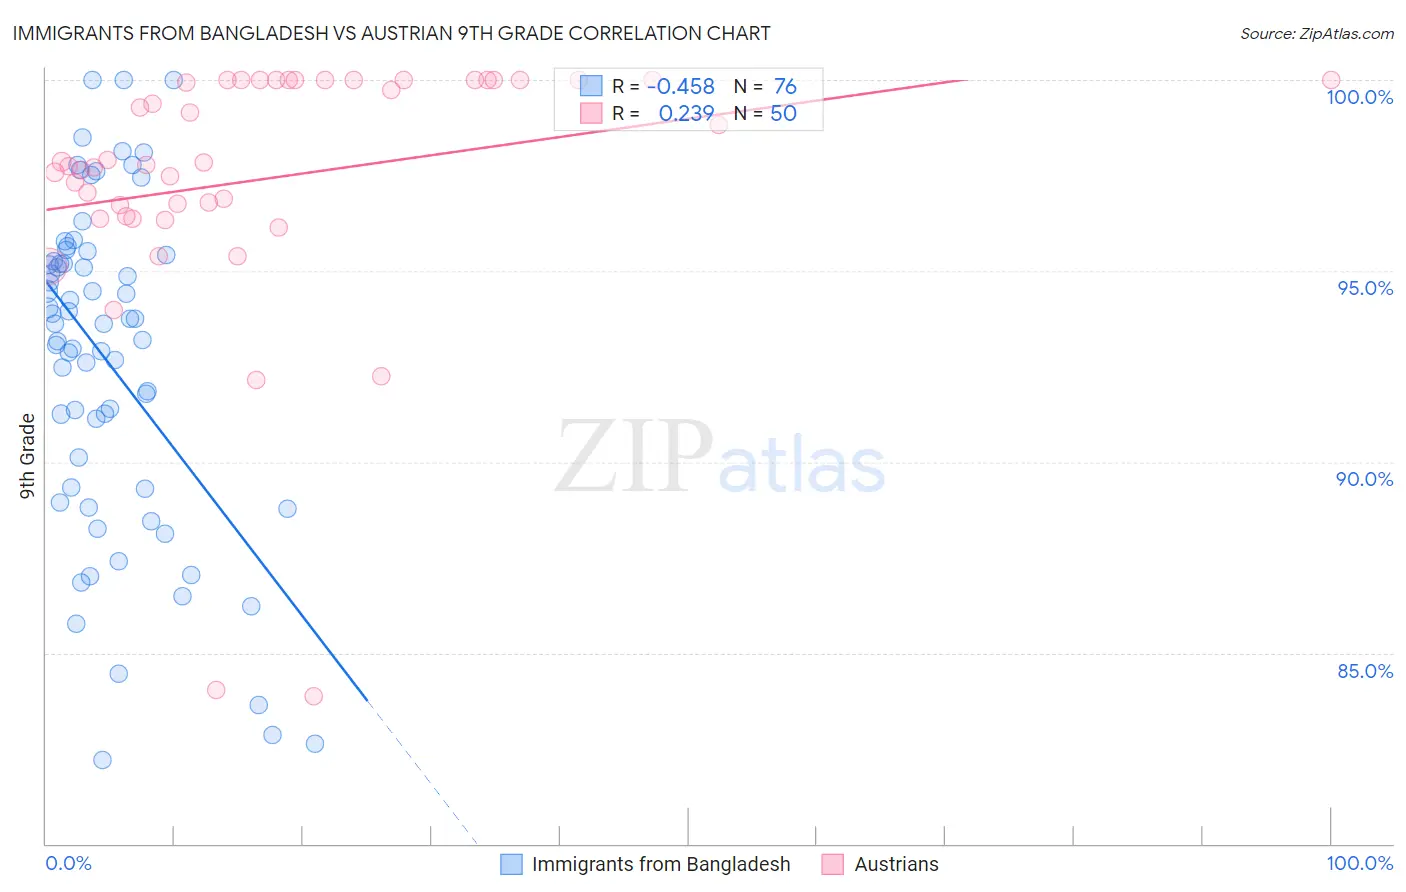
Immigrants from Bangladesh vs Austrian 9th Grade Correlation Chart
The statistical analysis conducted on geographies consisting of 203,672,706 people shows a moderate negative correlation between the proportion of Immigrants from Bangladesh and percentage of population with at least 9th grade education in the United States with a correlation coefficient (R) of -0.458 and weighted average of 92.4%. Similarly, the statistical analysis conducted on geographies consisting of 452,082,820 people shows a weak positive correlation between the proportion of Austrians and percentage of population with at least 9th grade education in the United States with a correlation coefficient (R) of 0.239 and weighted average of 96.0%, a difference of 3.9%.
9th Grade Correlation Summary
| Measurement | Immigrants from Bangladesh | Austrian |
| Minimum | 82.2% | 83.9% |
| Maximum | 100.0% | 100.0% |
| Range | 17.8% | 16.1% |
| Mean | 92.6% | 97.4% |
| Median | 93.6% | 97.8% |
| Interquartile 25% (IQ1) | 89.3% | 96.4% |
| Interquartile 75% (IQ3) | 95.3% | 100.0% |
| Interquartile Range (IQR) | 6.0% | 3.6% |
| Standard Deviation (Sample) | 4.3% | 3.4% |
| Standard Deviation (Population) | 4.3% | 3.4% |
Similar Demographics by 9th Grade
Demographics Similar to Immigrants from Bangladesh by 9th Grade
In terms of 9th grade, the demographic groups most similar to Immigrants from Bangladesh are Immigrants from Cambodia (92.4%, a difference of 0.030%), Immigrants from Fiji (92.3%, a difference of 0.050%), Houma (92.3%, a difference of 0.080%), Vietnamese (92.3%, a difference of 0.10%), and Immigrants from Portugal (92.2%, a difference of 0.14%).
| Demographics | Rating | Rank | 9th Grade |
| Immigrants | Dominica | 0.0 /100 | #302 | Tragic 92.7% |
| Guyanese | 0.0 /100 | #303 | Tragic 92.7% |
| Tohono O'odham | 0.0 /100 | #304 | Tragic 92.6% |
| Japanese | 0.0 /100 | #305 | Tragic 92.6% |
| Immigrants | Vietnam | 0.0 /100 | #306 | Tragic 92.6% |
| Immigrants | Immigrants | 0.0 /100 | #307 | Tragic 92.5% |
| Immigrants | Guyana | 0.0 /100 | #308 | Tragic 92.5% |
| Immigrants | Bangladesh | 0.0 /100 | #309 | Tragic 92.4% |
| Immigrants | Cambodia | 0.0 /100 | #310 | Tragic 92.4% |
| Immigrants | Fiji | 0.0 /100 | #311 | Tragic 92.3% |
| Houma | 0.0 /100 | #312 | Tragic 92.3% |
| Vietnamese | 0.0 /100 | #313 | Tragic 92.3% |
| Immigrants | Portugal | 0.0 /100 | #314 | Tragic 92.2% |
| Immigrants | Caribbean | 0.0 /100 | #315 | Tragic 92.2% |
| Cape Verdeans | 0.0 /100 | #316 | Tragic 92.2% |
Demographics Similar to Austrians by 9th Grade
In terms of 9th grade, the demographic groups most similar to Austrians are Serbian (96.0%, a difference of 0.010%), Immigrants from Canada (96.0%, a difference of 0.010%), Immigrants from Northern Europe (96.0%, a difference of 0.020%), Immigrants from Austria (96.0%, a difference of 0.020%), and Celtic (96.0%, a difference of 0.030%).
| Demographics | Rating | Rank | 9th Grade |
| Immigrants | India | 99.9 /100 | #46 | Exceptional 96.1% |
| Russians | 99.9 /100 | #47 | Exceptional 96.0% |
| Australians | 99.9 /100 | #48 | Exceptional 96.0% |
| Greeks | 99.9 /100 | #49 | Exceptional 96.0% |
| Celtics | 99.9 /100 | #50 | Exceptional 96.0% |
| Immigrants | Northern Europe | 99.9 /100 | #51 | Exceptional 96.0% |
| Serbians | 99.9 /100 | #52 | Exceptional 96.0% |
| Austrians | 99.8 /100 | #53 | Exceptional 96.0% |
| Immigrants | Canada | 99.8 /100 | #54 | Exceptional 96.0% |
| Immigrants | Austria | 99.8 /100 | #55 | Exceptional 96.0% |
| Immigrants | North America | 99.8 /100 | #56 | Exceptional 96.0% |
| Macedonians | 99.8 /100 | #57 | Exceptional 96.0% |
| Aleuts | 99.8 /100 | #58 | Exceptional 96.0% |
| New Zealanders | 99.8 /100 | #59 | Exceptional 95.9% |
| Native Hawaiians | 99.8 /100 | #60 | Exceptional 95.9% |