Immigrants from Liberia vs Sierra Leonean Associate's Degree
COMPARE
Immigrants from Liberia
Sierra Leonean
Associate's Degree
Associate's Degree Comparison
Immigrants from Liberia
Sierra Leoneans
42.3%
ASSOCIATE'S DEGREE
0.9/ 100
METRIC RATING
244th/ 347
METRIC RANK
47.7%
ASSOCIATE'S DEGREE
82.9/ 100
METRIC RATING
142nd/ 347
METRIC RANK
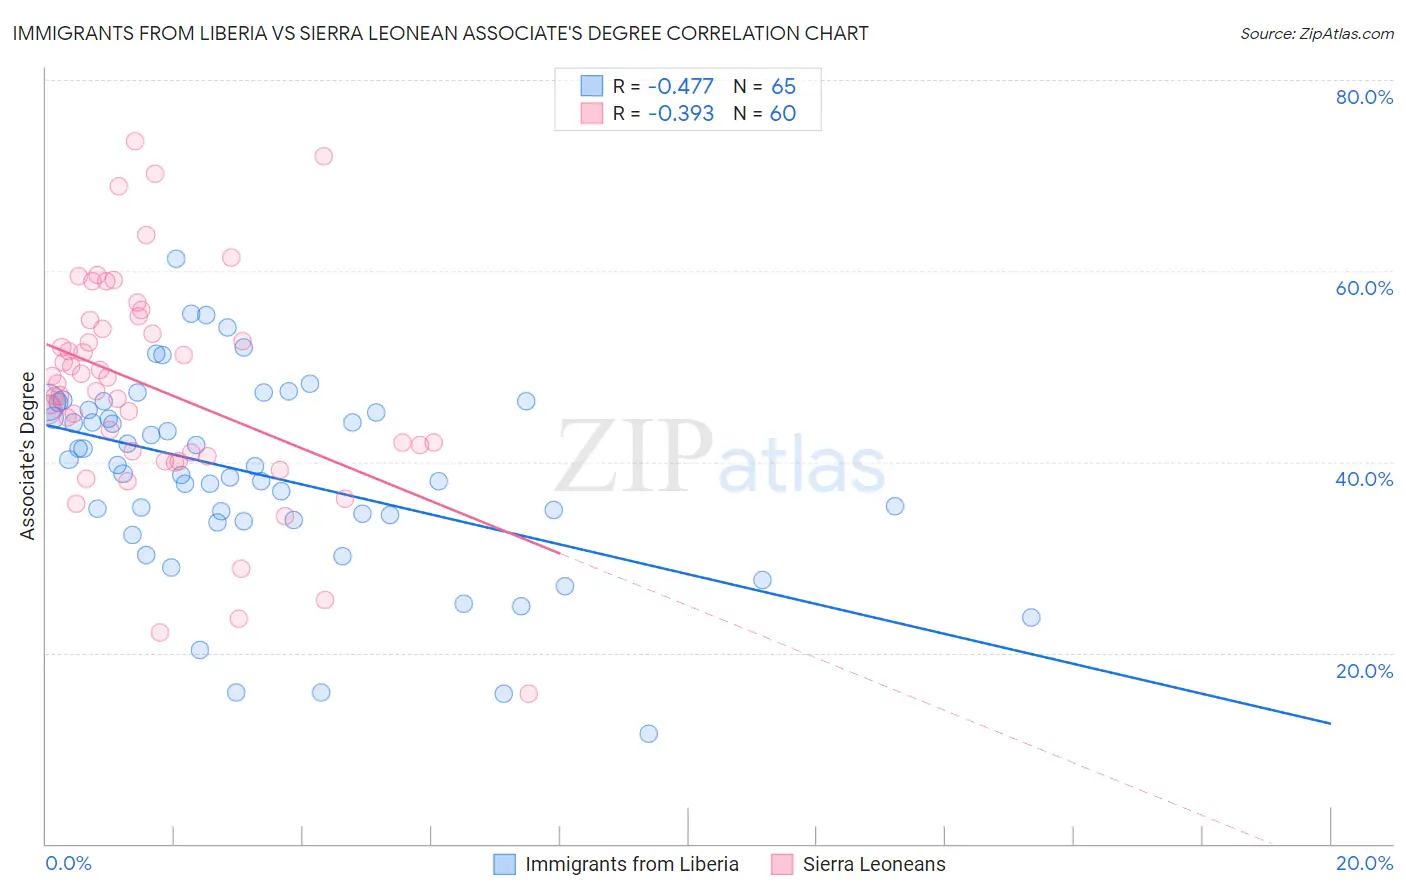
Immigrants from Liberia vs Sierra Leonean Associate's Degree Correlation Chart
The statistical analysis conducted on geographies consisting of 135,295,697 people shows a moderate negative correlation between the proportion of Immigrants from Liberia and percentage of population with at least associate's degree education in the United States with a correlation coefficient (R) of -0.477 and weighted average of 42.3%. Similarly, the statistical analysis conducted on geographies consisting of 83,364,635 people shows a mild negative correlation between the proportion of Sierra Leoneans and percentage of population with at least associate's degree education in the United States with a correlation coefficient (R) of -0.393 and weighted average of 47.7%, a difference of 12.9%.
Associate's Degree Correlation Summary
| Measurement | Immigrants from Liberia | Sierra Leonean |
| Minimum | 11.5% | 15.7% |
| Maximum | 61.3% | 73.5% |
| Range | 49.8% | 57.8% |
| Mean | 38.6% | 47.6% |
| Median | 39.5% | 47.8% |
| Interquartile 25% (IQ1) | 33.9% | 40.7% |
| Interquartile 75% (IQ3) | 45.8% | 54.4% |
| Interquartile Range (IQR) | 12.0% | 13.6% |
| Standard Deviation (Sample) | 10.2% | 11.7% |
| Standard Deviation (Population) | 10.2% | 11.6% |
Similar Demographics by Associate's Degree
Demographics Similar to Immigrants from Liberia by Associate's Degree
In terms of associate's degree, the demographic groups most similar to Immigrants from Liberia are Immigrants from Cambodia (42.3%, a difference of 0.020%), Delaware (42.3%, a difference of 0.050%), Guyanese (42.3%, a difference of 0.14%), Immigrants from Fiji (42.2%, a difference of 0.14%), and Immigrants from Ecuador (42.2%, a difference of 0.23%).
| Demographics | Rating | Rank | Associate's Degree |
| Immigrants | Nonimmigrants | 1.9 /100 | #237 | Tragic 42.9% |
| Iroquois | 1.7 /100 | #238 | Tragic 42.8% |
| Immigrants | Grenada | 1.3 /100 | #239 | Tragic 42.6% |
| Cree | 1.2 /100 | #240 | Tragic 42.5% |
| British West Indians | 1.0 /100 | #241 | Tragic 42.4% |
| Immigrants | West Indies | 1.0 /100 | #242 | Tragic 42.4% |
| Guyanese | 1.0 /100 | #243 | Tragic 42.3% |
| Immigrants | Liberia | 0.9 /100 | #244 | Tragic 42.3% |
| Immigrants | Cambodia | 0.9 /100 | #245 | Tragic 42.3% |
| Delaware | 0.9 /100 | #246 | Tragic 42.3% |
| Immigrants | Fiji | 0.8 /100 | #247 | Tragic 42.2% |
| Immigrants | Ecuador | 0.8 /100 | #248 | Tragic 42.2% |
| Jamaicans | 0.7 /100 | #249 | Tragic 42.1% |
| U.S. Virgin Islanders | 0.7 /100 | #250 | Tragic 42.1% |
| Immigrants | Bahamas | 0.7 /100 | #251 | Tragic 42.1% |
Demographics Similar to Sierra Leoneans by Associate's Degree
In terms of associate's degree, the demographic groups most similar to Sierra Leoneans are Taiwanese (47.7%, a difference of 0.050%), Immigrants from Southern Europe (47.8%, a difference of 0.20%), Norwegian (47.6%, a difference of 0.23%), Slavic (47.6%, a difference of 0.29%), and Slovene (47.9%, a difference of 0.30%).
| Demographics | Rating | Rank | Associate's Degree |
| Europeans | 89.0 /100 | #135 | Excellent 48.2% |
| Pakistanis | 88.0 /100 | #136 | Excellent 48.1% |
| Immigrants | Eritrea | 87.8 /100 | #137 | Excellent 48.1% |
| Poles | 87.3 /100 | #138 | Excellent 48.0% |
| Slovenes | 85.1 /100 | #139 | Excellent 47.9% |
| Immigrants | Southern Europe | 84.4 /100 | #140 | Excellent 47.8% |
| Taiwanese | 83.3 /100 | #141 | Excellent 47.7% |
| Sierra Leoneans | 82.9 /100 | #142 | Excellent 47.7% |
| Norwegians | 81.0 /100 | #143 | Excellent 47.6% |
| Slavs | 80.5 /100 | #144 | Excellent 47.6% |
| Canadians | 79.0 /100 | #145 | Good 47.5% |
| Immigrants | Sudan | 77.9 /100 | #146 | Good 47.4% |
| Danes | 77.3 /100 | #147 | Good 47.4% |
| South American Indians | 76.7 /100 | #148 | Good 47.4% |
| Immigrants | Armenia | 76.6 /100 | #149 | Good 47.4% |