Immigrants from Latvia vs American 6th Grade
COMPARE
Immigrants from Latvia
American
6th Grade
6th Grade Comparison
Immigrants from Latvia
Americans
97.4%
6TH GRADE
96.7/ 100
METRIC RATING
112th/ 347
METRIC RANK
97.7%
6TH GRADE
99.8/ 100
METRIC RATING
59th/ 347
METRIC RANK
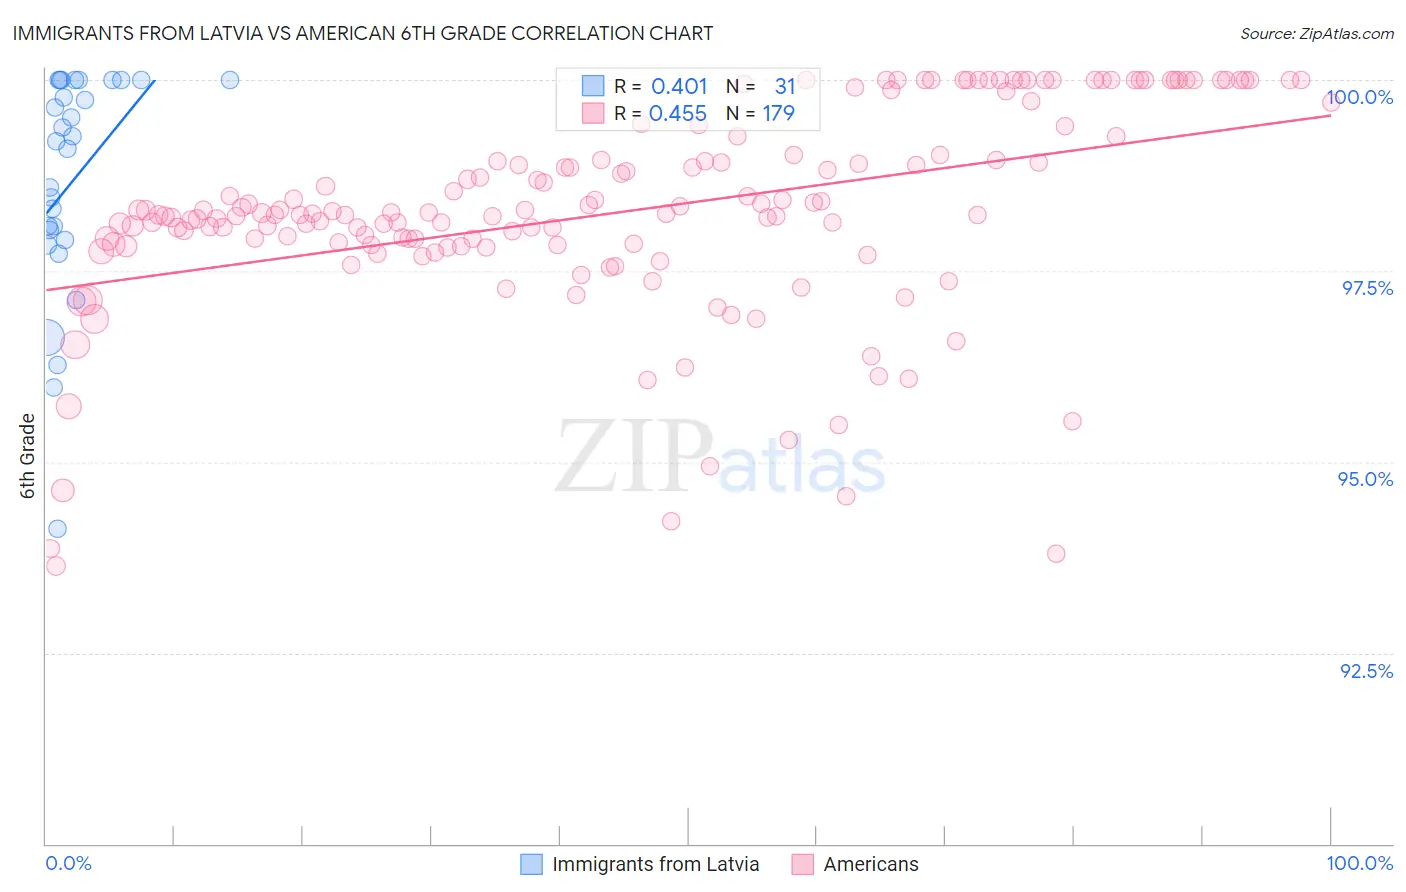
Immigrants from Latvia vs American 6th Grade Correlation Chart
The statistical analysis conducted on geographies consisting of 113,735,345 people shows a moderate positive correlation between the proportion of Immigrants from Latvia and percentage of population with at least 6th grade education in the United States with a correlation coefficient (R) of 0.401 and weighted average of 97.4%. Similarly, the statistical analysis conducted on geographies consisting of 581,993,755 people shows a moderate positive correlation between the proportion of Americans and percentage of population with at least 6th grade education in the United States with a correlation coefficient (R) of 0.455 and weighted average of 97.7%, a difference of 0.30%.
6th Grade Correlation Summary
| Measurement | Immigrants from Latvia | American |
| Minimum | 94.1% | 93.6% |
| Maximum | 100.0% | 100.0% |
| Range | 5.9% | 6.4% |
| Mean | 98.7% | 98.3% |
| Median | 99.2% | 98.2% |
| Interquartile 25% (IQ1) | 97.9% | 97.8% |
| Interquartile 75% (IQ3) | 100.0% | 99.0% |
| Interquartile Range (IQR) | 2.1% | 1.2% |
| Standard Deviation (Sample) | 1.5% | 1.4% |
| Standard Deviation (Population) | 1.4% | 1.3% |
Similar Demographics by 6th Grade
Demographics Similar to Immigrants from Latvia by 6th Grade
In terms of 6th grade, the demographic groups most similar to Immigrants from Latvia are Thai (97.4%, a difference of 0.010%), Iroquois (97.4%, a difference of 0.010%), Immigrants from Saudi Arabia (97.4%, a difference of 0.010%), Colville (97.4%, a difference of 0.010%), and Nonimmigrants (97.4%, a difference of 0.020%).
| Demographics | Rating | Rank | 6th Grade |
| Cheyenne | 97.9 /100 | #105 | Exceptional 97.5% |
| Menominee | 97.7 /100 | #106 | Exceptional 97.5% |
| Immigrants | Singapore | 97.6 /100 | #107 | Exceptional 97.5% |
| Immigrants | Nonimmigrants | 97.3 /100 | #108 | Exceptional 97.4% |
| Immigrants | Czechoslovakia | 97.3 /100 | #109 | Exceptional 97.4% |
| Thais | 96.9 /100 | #110 | Exceptional 97.4% |
| Iroquois | 96.9 /100 | #111 | Exceptional 97.4% |
| Immigrants | Latvia | 96.7 /100 | #112 | Exceptional 97.4% |
| Immigrants | Saudi Arabia | 96.5 /100 | #113 | Exceptional 97.4% |
| Colville | 96.4 /100 | #114 | Exceptional 97.4% |
| Immigrants | Switzerland | 95.7 /100 | #115 | Exceptional 97.4% |
| Lebanese | 95.5 /100 | #116 | Exceptional 97.4% |
| Basques | 95.4 /100 | #117 | Exceptional 97.4% |
| Immigrants | Japan | 95.2 /100 | #118 | Exceptional 97.4% |
| Immigrants | Zimbabwe | 95.0 /100 | #119 | Exceptional 97.4% |
Demographics Similar to Americans by 6th Grade
In terms of 6th grade, the demographic groups most similar to Americans are White/Caucasian (97.7%, a difference of 0.010%), Greek (97.7%, a difference of 0.010%), Immigrants from Canada (97.7%, a difference of 0.010%), Serbian (97.7%, a difference of 0.010%), and Austrian (97.7%, a difference of 0.020%).
| Demographics | Rating | Rank | 6th Grade |
| Australians | 99.8 /100 | #52 | Exceptional 97.8% |
| Slavs | 99.8 /100 | #53 | Exceptional 97.8% |
| Creek | 99.8 /100 | #54 | Exceptional 97.7% |
| Aleuts | 99.8 /100 | #55 | Exceptional 97.7% |
| Austrians | 99.8 /100 | #56 | Exceptional 97.7% |
| Whites/Caucasians | 99.8 /100 | #57 | Exceptional 97.7% |
| Greeks | 99.8 /100 | #58 | Exceptional 97.7% |
| Americans | 99.8 /100 | #59 | Exceptional 97.7% |
| Immigrants | Canada | 99.8 /100 | #60 | Exceptional 97.7% |
| Serbians | 99.7 /100 | #61 | Exceptional 97.7% |
| Immigrants | North America | 99.7 /100 | #62 | Exceptional 97.7% |
| Russians | 99.7 /100 | #63 | Exceptional 97.7% |
| Canadians | 99.7 /100 | #64 | Exceptional 97.7% |
| Immigrants | Northern Europe | 99.6 /100 | #65 | Exceptional 97.7% |
| New Zealanders | 99.6 /100 | #66 | Exceptional 97.7% |