Immigrants from Kuwait vs Immigrants from Canada 6th Grade
COMPARE
Immigrants from Kuwait
Immigrants from Canada
6th Grade
6th Grade Comparison
Immigrants from Kuwait
Immigrants from Canada
97.3%
6TH GRADE
89.5/ 100
METRIC RATING
134th/ 347
METRIC RANK
97.7%
6TH GRADE
99.8/ 100
METRIC RATING
60th/ 347
METRIC RANK
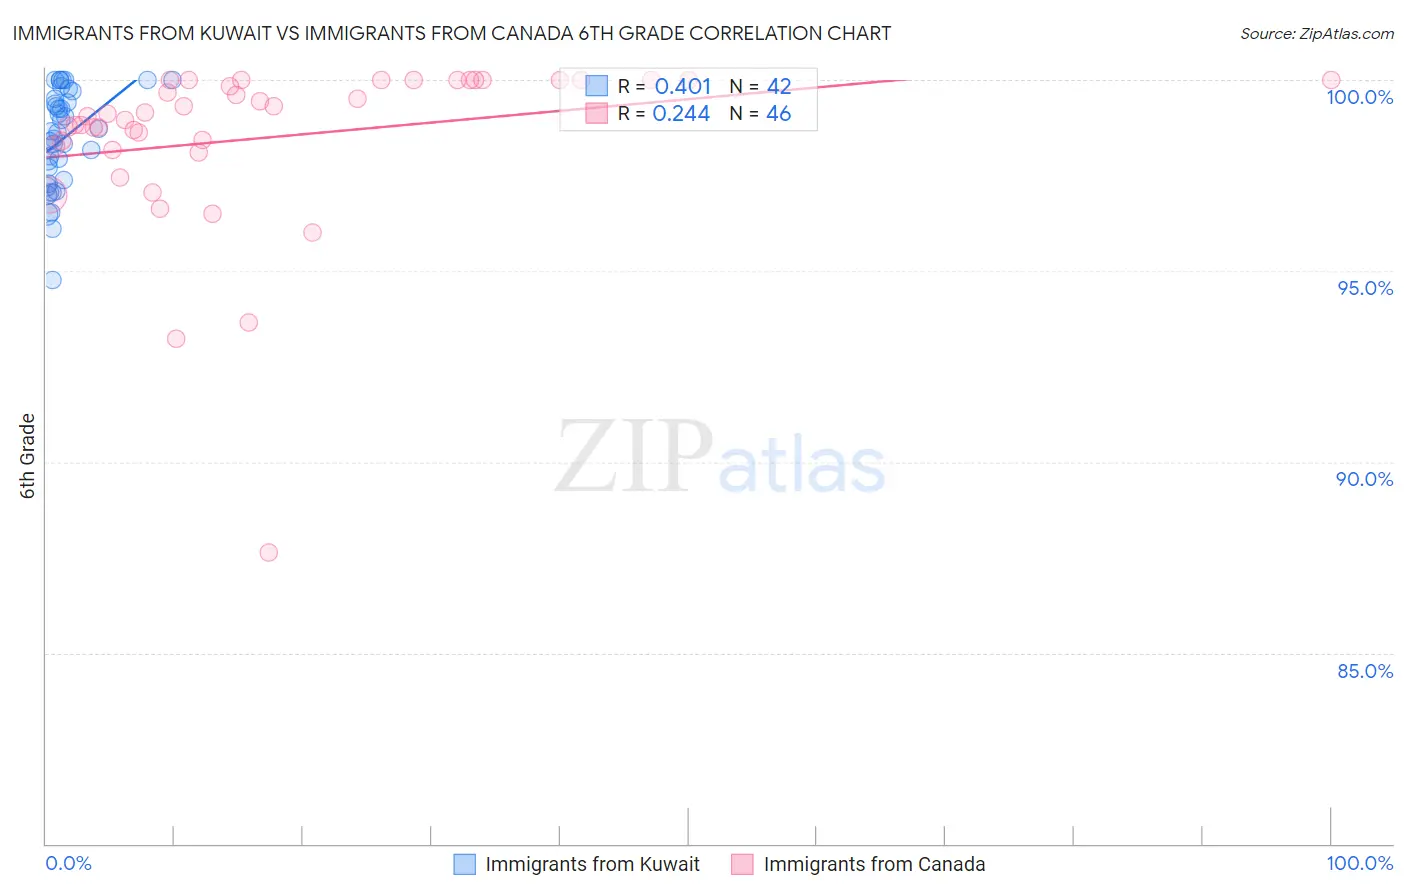
Immigrants from Kuwait vs Immigrants from Canada 6th Grade Correlation Chart
The statistical analysis conducted on geographies consisting of 136,913,666 people shows a moderate positive correlation between the proportion of Immigrants from Kuwait and percentage of population with at least 6th grade education in the United States with a correlation coefficient (R) of 0.401 and weighted average of 97.3%. Similarly, the statistical analysis conducted on geographies consisting of 459,397,484 people shows a weak positive correlation between the proportion of Immigrants from Canada and percentage of population with at least 6th grade education in the United States with a correlation coefficient (R) of 0.244 and weighted average of 97.7%, a difference of 0.44%.
6th Grade Correlation Summary
| Measurement | Immigrants from Kuwait | Immigrants from Canada |
| Minimum | 94.8% | 87.6% |
| Maximum | 100.0% | 100.0% |
| Range | 5.2% | 12.4% |
| Mean | 98.5% | 98.5% |
| Median | 98.6% | 99.1% |
| Interquartile 25% (IQ1) | 97.4% | 98.3% |
| Interquartile 75% (IQ3) | 99.5% | 100.0% |
| Interquartile Range (IQR) | 2.1% | 1.7% |
| Standard Deviation (Sample) | 1.3% | 2.3% |
| Standard Deviation (Population) | 1.3% | 2.2% |
Similar Demographics by 6th Grade
Demographics Similar to Immigrants from Kuwait by 6th Grade
In terms of 6th grade, the demographic groups most similar to Immigrants from Kuwait are Immigrants from Hungary (97.3%, a difference of 0.0%), Immigrants from Moldova (97.3%, a difference of 0.010%), Filipino (97.3%, a difference of 0.010%), Immigrants from Europe (97.3%, a difference of 0.020%), and Palestinian (97.3%, a difference of 0.020%).
| Demographics | Rating | Rank | 6th Grade |
| Immigrants | Croatia | 93.1 /100 | #127 | Exceptional 97.3% |
| Immigrants | Romania | 92.0 /100 | #128 | Exceptional 97.3% |
| Immigrants | Serbia | 91.9 /100 | #129 | Exceptional 97.3% |
| Cambodians | 91.8 /100 | #130 | Exceptional 97.3% |
| Immigrants | Europe | 91.1 /100 | #131 | Exceptional 97.3% |
| Palestinians | 90.9 /100 | #132 | Exceptional 97.3% |
| Immigrants | Moldova | 90.0 /100 | #133 | Excellent 97.3% |
| Immigrants | Kuwait | 89.5 /100 | #134 | Excellent 97.3% |
| Immigrants | Hungary | 89.5 /100 | #135 | Excellent 97.3% |
| Filipinos | 88.9 /100 | #136 | Excellent 97.3% |
| Burmese | 87.8 /100 | #137 | Excellent 97.3% |
| Blackfeet | 87.7 /100 | #138 | Excellent 97.3% |
| Immigrants | Turkey | 86.1 /100 | #139 | Excellent 97.3% |
| Immigrants | North Macedonia | 85.5 /100 | #140 | Excellent 97.2% |
| Seminole | 84.8 /100 | #141 | Excellent 97.2% |
Demographics Similar to Immigrants from Canada by 6th Grade
In terms of 6th grade, the demographic groups most similar to Immigrants from Canada are Serbian (97.7%, a difference of 0.0%), Greek (97.7%, a difference of 0.010%), American (97.7%, a difference of 0.010%), Immigrants from North America (97.7%, a difference of 0.010%), and White/Caucasian (97.7%, a difference of 0.020%).
| Demographics | Rating | Rank | 6th Grade |
| Slavs | 99.8 /100 | #53 | Exceptional 97.8% |
| Creek | 99.8 /100 | #54 | Exceptional 97.7% |
| Aleuts | 99.8 /100 | #55 | Exceptional 97.7% |
| Austrians | 99.8 /100 | #56 | Exceptional 97.7% |
| Whites/Caucasians | 99.8 /100 | #57 | Exceptional 97.7% |
| Greeks | 99.8 /100 | #58 | Exceptional 97.7% |
| Americans | 99.8 /100 | #59 | Exceptional 97.7% |
| Immigrants | Canada | 99.8 /100 | #60 | Exceptional 97.7% |
| Serbians | 99.7 /100 | #61 | Exceptional 97.7% |
| Immigrants | North America | 99.7 /100 | #62 | Exceptional 97.7% |
| Russians | 99.7 /100 | #63 | Exceptional 97.7% |
| Canadians | 99.7 /100 | #64 | Exceptional 97.7% |
| Immigrants | Northern Europe | 99.6 /100 | #65 | Exceptional 97.7% |
| New Zealanders | 99.6 /100 | #66 | Exceptional 97.7% |
| Kiowa | 99.6 /100 | #67 | Exceptional 97.7% |