Immigrants from Kuwait vs Danish Professional Degree
COMPARE
Immigrants from Kuwait
Danish
Professional Degree
Professional Degree Comparison
Immigrants from Kuwait
Danes
5.7%
PROFESSIONAL DEGREE
100.0/ 100
METRIC RATING
54th/ 347
METRIC RANK
4.4%
PROFESSIONAL DEGREE
43.5/ 100
METRIC RATING
181st/ 347
METRIC RANK
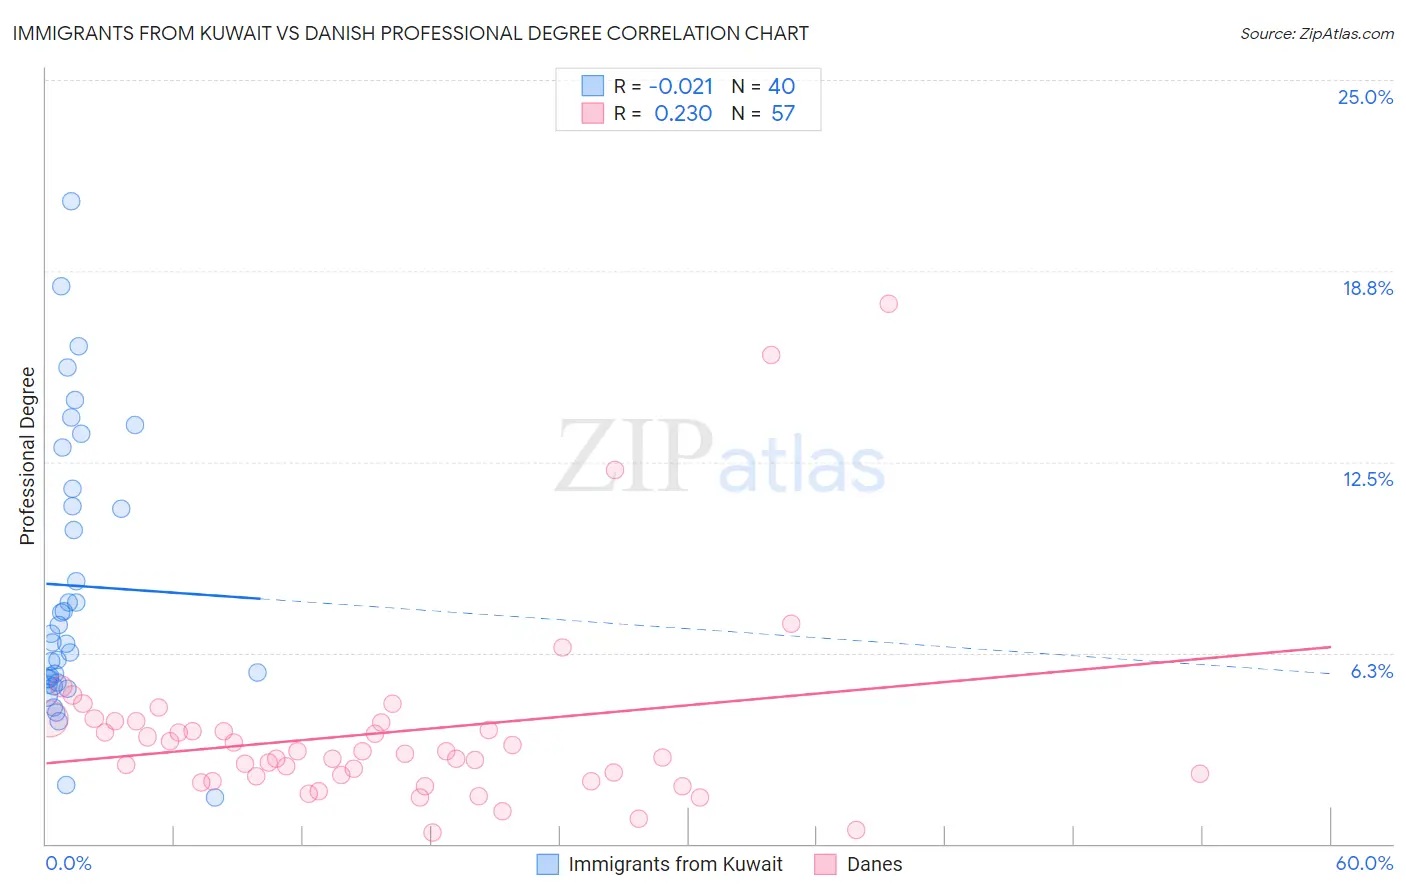
Immigrants from Kuwait vs Danish Professional Degree Correlation Chart
The statistical analysis conducted on geographies consisting of 136,863,125 people shows no correlation between the proportion of Immigrants from Kuwait and percentage of population with at least professional degree education in the United States with a correlation coefficient (R) of -0.021 and weighted average of 5.7%. Similarly, the statistical analysis conducted on geographies consisting of 471,556,921 people shows a weak positive correlation between the proportion of Danes and percentage of population with at least professional degree education in the United States with a correlation coefficient (R) of 0.230 and weighted average of 4.4%, a difference of 31.6%.
Professional Degree Correlation Summary
| Measurement | Immigrants from Kuwait | Danish |
| Minimum | 1.5% | 0.37% |
| Maximum | 21.0% | 17.7% |
| Range | 19.5% | 17.3% |
| Mean | 8.4% | 3.6% |
| Median | 6.7% | 2.9% |
| Interquartile 25% (IQ1) | 5.3% | 2.1% |
| Interquartile 75% (IQ3) | 11.3% | 4.0% |
| Interquartile Range (IQR) | 6.0% | 1.8% |
| Standard Deviation (Sample) | 4.5% | 3.1% |
| Standard Deviation (Population) | 4.5% | 3.1% |
Similar Demographics by Professional Degree
Demographics Similar to Immigrants from Kuwait by Professional Degree
In terms of professional degree, the demographic groups most similar to Immigrants from Kuwait are Immigrants from Western Europe (5.7%, a difference of 0.40%), Immigrants from Malaysia (5.7%, a difference of 0.52%), South African (5.7%, a difference of 0.79%), Immigrants from Netherlands (5.8%, a difference of 1.0%), and Immigrants from Serbia (5.8%, a difference of 1.2%).
| Demographics | Rating | Rank | Professional Degree |
| Australians | 100.0 /100 | #47 | Exceptional 5.9% |
| Paraguayans | 100.0 /100 | #48 | Exceptional 5.9% |
| Immigrants | Latvia | 100.0 /100 | #49 | Exceptional 5.8% |
| Immigrants | Czechoslovakia | 100.0 /100 | #50 | Exceptional 5.8% |
| Immigrants | Greece | 100.0 /100 | #51 | Exceptional 5.8% |
| Immigrants | Serbia | 100.0 /100 | #52 | Exceptional 5.8% |
| Immigrants | Netherlands | 100.0 /100 | #53 | Exceptional 5.8% |
| Immigrants | Kuwait | 100.0 /100 | #54 | Exceptional 5.7% |
| Immigrants | Western Europe | 100.0 /100 | #55 | Exceptional 5.7% |
| Immigrants | Malaysia | 100.0 /100 | #56 | Exceptional 5.7% |
| South Africans | 100.0 /100 | #57 | Exceptional 5.7% |
| Bulgarians | 100.0 /100 | #58 | Exceptional 5.7% |
| Immigrants | Europe | 100.0 /100 | #59 | Exceptional 5.6% |
| Bolivians | 99.9 /100 | #60 | Exceptional 5.6% |
| Immigrants | Lithuania | 99.9 /100 | #61 | Exceptional 5.6% |
Demographics Similar to Danes by Professional Degree
In terms of professional degree, the demographic groups most similar to Danes are Immigrants (4.4%, a difference of 0.040%), Bermudan (4.4%, a difference of 0.060%), Czech (4.4%, a difference of 0.22%), Immigrants from Kenya (4.4%, a difference of 0.36%), and Immigrants from Costa Rica (4.4%, a difference of 0.47%).
| Demographics | Rating | Rank | Professional Degree |
| Kenyans | 50.0 /100 | #174 | Average 4.4% |
| Irish | 50.0 /100 | #175 | Average 4.4% |
| Immigrants | Peru | 49.3 /100 | #176 | Average 4.4% |
| Celtics | 47.6 /100 | #177 | Average 4.4% |
| Immigrants | Costa Rica | 46.7 /100 | #178 | Average 4.4% |
| Immigrants | Kenya | 45.9 /100 | #179 | Average 4.4% |
| Czechs | 44.9 /100 | #180 | Average 4.4% |
| Danes | 43.5 /100 | #181 | Average 4.4% |
| Immigrants | Immigrants | 43.2 /100 | #182 | Average 4.4% |
| Bermudans | 43.1 /100 | #183 | Average 4.4% |
| Belgians | 36.2 /100 | #184 | Fair 4.3% |
| Welsh | 35.8 /100 | #185 | Fair 4.3% |
| Scotch-Irish | 34.2 /100 | #186 | Fair 4.3% |
| Immigrants | Cameroon | 33.3 /100 | #187 | Fair 4.3% |
| Immigrants | Thailand | 31.7 /100 | #188 | Fair 4.3% |