Immigrants from Kuwait vs Danish 1st Grade
COMPARE
Immigrants from Kuwait
Danish
1st Grade
1st Grade Comparison
Immigrants from Kuwait
Danes
98.1%
1ST GRADE
89.3/ 100
METRIC RATING
135th/ 347
METRIC RANK
98.6%
1ST GRADE
100.0/ 100
METRIC RATING
25th/ 347
METRIC RANK
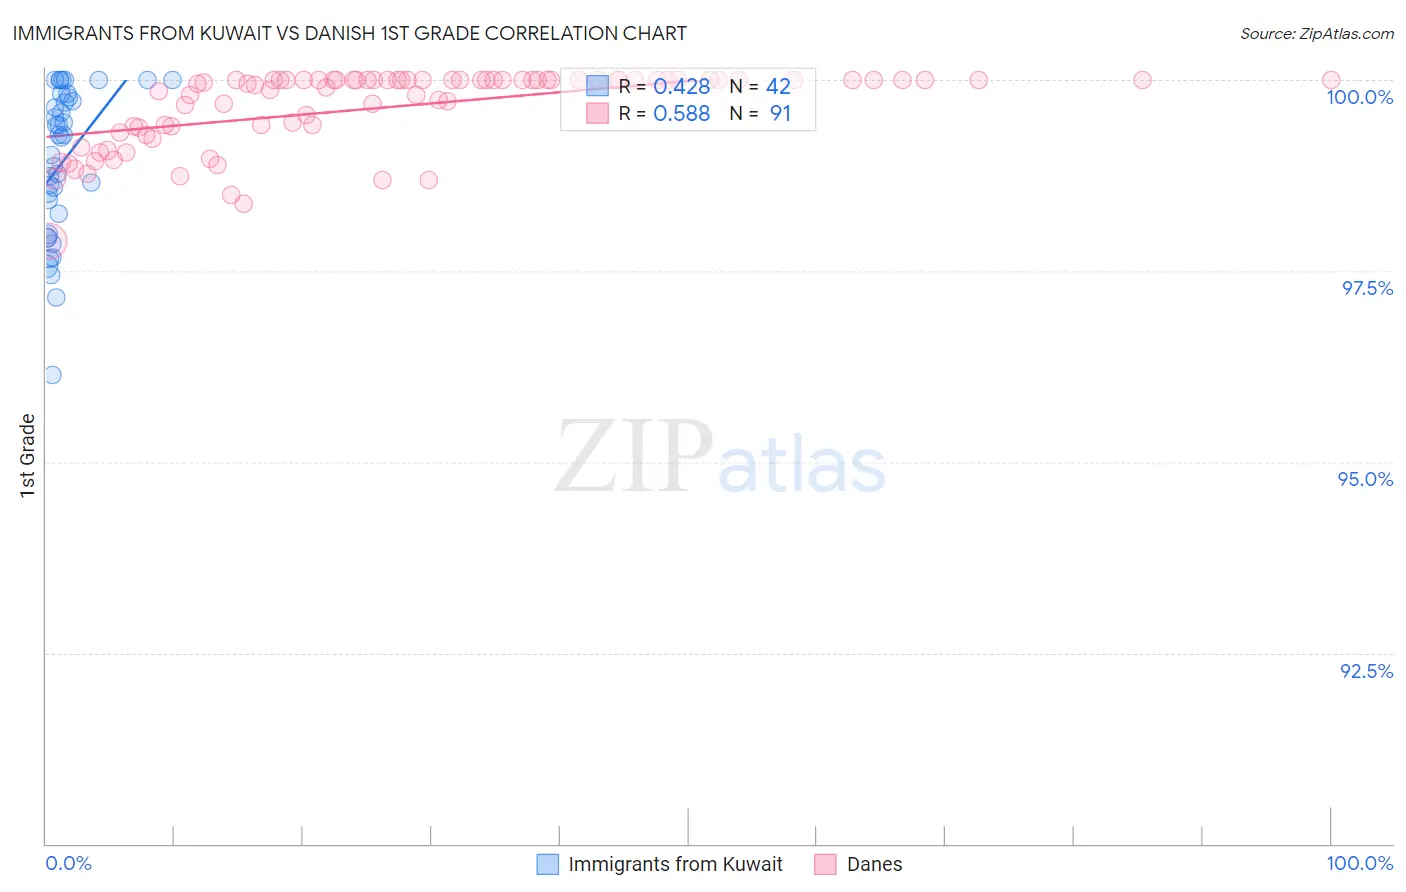
Immigrants from Kuwait vs Danish 1st Grade Correlation Chart
The statistical analysis conducted on geographies consisting of 136,913,666 people shows a moderate positive correlation between the proportion of Immigrants from Kuwait and percentage of population with at least 1st grade education in the United States with a correlation coefficient (R) of 0.428 and weighted average of 98.1%. Similarly, the statistical analysis conducted on geographies consisting of 474,193,610 people shows a substantial positive correlation between the proportion of Danes and percentage of population with at least 1st grade education in the United States with a correlation coefficient (R) of 0.588 and weighted average of 98.6%, a difference of 0.51%.
1st Grade Correlation Summary
| Measurement | Immigrants from Kuwait | Danish |
| Minimum | 96.1% | 97.9% |
| Maximum | 100.0% | 100.0% |
| Range | 3.9% | 2.1% |
| Mean | 98.9% | 99.6% |
| Median | 99.3% | 100.0% |
| Interquartile 25% (IQ1) | 98.2% | 99.4% |
| Interquartile 75% (IQ3) | 99.8% | 100.0% |
| Interquartile Range (IQR) | 1.5% | 0.63% |
| Standard Deviation (Sample) | 0.97% | 0.50% |
| Standard Deviation (Population) | 0.96% | 0.50% |
Similar Demographics by 1st Grade
Demographics Similar to Immigrants from Kuwait by 1st Grade
In terms of 1st grade, the demographic groups most similar to Immigrants from Kuwait are Immigrants from Hungary (98.1%, a difference of 0.0%), Immigrants from Bulgaria (98.1%, a difference of 0.0%), Cambodian (98.1%, a difference of 0.010%), Immigrants from Europe (98.1%, a difference of 0.010%), and Israeli (98.1%, a difference of 0.010%).
| Demographics | Rating | Rank | 1st Grade |
| Immigrants | Serbia | 92.2 /100 | #128 | Exceptional 98.1% |
| Seminole | 91.9 /100 | #129 | Exceptional 98.1% |
| Immigrants | Croatia | 91.4 /100 | #130 | Exceptional 98.1% |
| Spaniards | 91.2 /100 | #131 | Exceptional 98.1% |
| Cambodians | 90.9 /100 | #132 | Exceptional 98.1% |
| Immigrants | Europe | 90.5 /100 | #133 | Exceptional 98.1% |
| Immigrants | Hungary | 89.4 /100 | #134 | Excellent 98.1% |
| Immigrants | Kuwait | 89.3 /100 | #135 | Excellent 98.1% |
| Immigrants | Bulgaria | 88.8 /100 | #136 | Excellent 98.1% |
| Israelis | 87.8 /100 | #137 | Excellent 98.1% |
| Immigrants | Romania | 87.8 /100 | #138 | Excellent 98.1% |
| Blackfeet | 87.6 /100 | #139 | Excellent 98.1% |
| Palestinians | 83.0 /100 | #140 | Excellent 98.0% |
| Immigrants | Turkey | 82.8 /100 | #141 | Excellent 98.0% |
| Marshallese | 82.0 /100 | #142 | Excellent 98.0% |
Demographics Similar to Danes by 1st Grade
In terms of 1st grade, the demographic groups most similar to Danes are Sioux (98.6%, a difference of 0.0%), Arapaho (98.6%, a difference of 0.0%), Pennsylvania German (98.6%, a difference of 0.0%), Finnish (98.6%, a difference of 0.0%), and Lithuanian (98.6%, a difference of 0.0%).
| Demographics | Rating | Rank | 1st Grade |
| Dutch | 100.0 /100 | #18 | Exceptional 98.6% |
| Irish | 100.0 /100 | #19 | Exceptional 98.6% |
| Sioux | 100.0 /100 | #20 | Exceptional 98.6% |
| Arapaho | 100.0 /100 | #21 | Exceptional 98.6% |
| Pennsylvania Germans | 100.0 /100 | #22 | Exceptional 98.6% |
| Finns | 100.0 /100 | #23 | Exceptional 98.6% |
| Lithuanians | 100.0 /100 | #24 | Exceptional 98.6% |
| Danes | 100.0 /100 | #25 | Exceptional 98.6% |
| Scotch-Irish | 100.0 /100 | #26 | Exceptional 98.6% |
| Poles | 100.0 /100 | #27 | Exceptional 98.6% |
| Croatians | 100.0 /100 | #28 | Exceptional 98.6% |
| French | 100.0 /100 | #29 | Exceptional 98.6% |
| Europeans | 100.0 /100 | #30 | Exceptional 98.5% |
| Czechs | 100.0 /100 | #31 | Exceptional 98.5% |
| French Canadians | 100.0 /100 | #32 | Exceptional 98.5% |