Immigrants from Kuwait vs Ghanaian 1st Grade
COMPARE
Immigrants from Kuwait
Ghanaian
1st Grade
1st Grade Comparison
Immigrants from Kuwait
Ghanaians
98.1%
1ST GRADE
89.3/ 100
METRIC RATING
135th/ 347
METRIC RANK
97.4%
1ST GRADE
0.1/ 100
METRIC RATING
274th/ 347
METRIC RANK
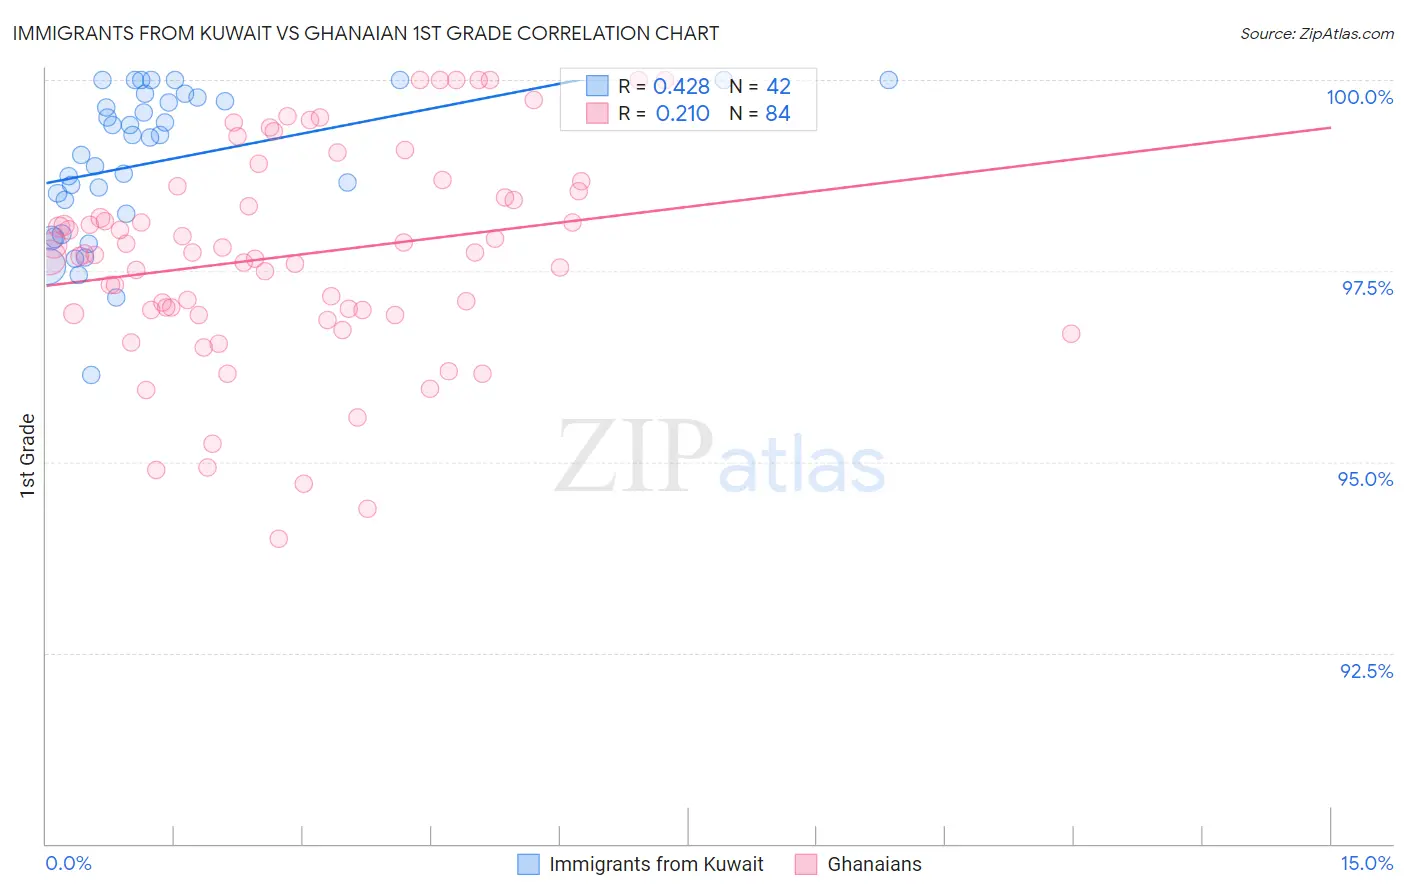
Immigrants from Kuwait vs Ghanaian 1st Grade Correlation Chart
The statistical analysis conducted on geographies consisting of 136,913,666 people shows a moderate positive correlation between the proportion of Immigrants from Kuwait and percentage of population with at least 1st grade education in the United States with a correlation coefficient (R) of 0.428 and weighted average of 98.1%. Similarly, the statistical analysis conducted on geographies consisting of 190,712,873 people shows a weak positive correlation between the proportion of Ghanaians and percentage of population with at least 1st grade education in the United States with a correlation coefficient (R) of 0.210 and weighted average of 97.4%, a difference of 0.69%.
1st Grade Correlation Summary
| Measurement | Immigrants from Kuwait | Ghanaian |
| Minimum | 96.1% | 94.0% |
| Maximum | 100.0% | 100.0% |
| Range | 3.9% | 6.0% |
| Mean | 98.9% | 97.7% |
| Median | 99.3% | 97.7% |
| Interquartile 25% (IQ1) | 98.2% | 97.0% |
| Interquartile 75% (IQ3) | 99.8% | 98.6% |
| Interquartile Range (IQR) | 1.5% | 1.6% |
| Standard Deviation (Sample) | 0.97% | 1.4% |
| Standard Deviation (Population) | 0.96% | 1.4% |
Similar Demographics by 1st Grade
Demographics Similar to Immigrants from Kuwait by 1st Grade
In terms of 1st grade, the demographic groups most similar to Immigrants from Kuwait are Immigrants from Hungary (98.1%, a difference of 0.0%), Immigrants from Bulgaria (98.1%, a difference of 0.0%), Cambodian (98.1%, a difference of 0.010%), Immigrants from Europe (98.1%, a difference of 0.010%), and Israeli (98.1%, a difference of 0.010%).
| Demographics | Rating | Rank | 1st Grade |
| Immigrants | Serbia | 92.2 /100 | #128 | Exceptional 98.1% |
| Seminole | 91.9 /100 | #129 | Exceptional 98.1% |
| Immigrants | Croatia | 91.4 /100 | #130 | Exceptional 98.1% |
| Spaniards | 91.2 /100 | #131 | Exceptional 98.1% |
| Cambodians | 90.9 /100 | #132 | Exceptional 98.1% |
| Immigrants | Europe | 90.5 /100 | #133 | Exceptional 98.1% |
| Immigrants | Hungary | 89.4 /100 | #134 | Excellent 98.1% |
| Immigrants | Kuwait | 89.3 /100 | #135 | Excellent 98.1% |
| Immigrants | Bulgaria | 88.8 /100 | #136 | Excellent 98.1% |
| Israelis | 87.8 /100 | #137 | Excellent 98.1% |
| Immigrants | Romania | 87.8 /100 | #138 | Excellent 98.1% |
| Blackfeet | 87.6 /100 | #139 | Excellent 98.1% |
| Palestinians | 83.0 /100 | #140 | Excellent 98.0% |
| Immigrants | Turkey | 82.8 /100 | #141 | Excellent 98.0% |
| Marshallese | 82.0 /100 | #142 | Excellent 98.0% |
Demographics Similar to Ghanaians by 1st Grade
In terms of 1st grade, the demographic groups most similar to Ghanaians are Immigrants from China (97.4%, a difference of 0.0%), Immigrants from Philippines (97.4%, a difference of 0.020%), Immigrants from Cameroon (97.4%, a difference of 0.030%), Immigrants from Peru (97.4%, a difference of 0.030%), and Immigrants from Bolivia (97.4%, a difference of 0.030%).
| Demographics | Rating | Rank | 1st Grade |
| Immigrants | Sierra Leone | 0.3 /100 | #267 | Tragic 97.5% |
| Immigrants | Nigeria | 0.3 /100 | #268 | Tragic 97.5% |
| West Indians | 0.3 /100 | #269 | Tragic 97.5% |
| Immigrants | Jamaica | 0.2 /100 | #270 | Tragic 97.5% |
| Immigrants | Cameroon | 0.2 /100 | #271 | Tragic 97.4% |
| Immigrants | Peru | 0.2 /100 | #272 | Tragic 97.4% |
| Immigrants | Bolivia | 0.2 /100 | #273 | Tragic 97.4% |
| Ghanaians | 0.1 /100 | #274 | Tragic 97.4% |
| Immigrants | China | 0.1 /100 | #275 | Tragic 97.4% |
| Immigrants | Philippines | 0.1 /100 | #276 | Tragic 97.4% |
| Immigrants | Western Africa | 0.1 /100 | #277 | Tragic 97.4% |
| Immigrants | Uzbekistan | 0.1 /100 | #278 | Tragic 97.4% |
| Immigrants | Ghana | 0.1 /100 | #279 | Tragic 97.4% |
| Afghans | 0.1 /100 | #280 | Tragic 97.4% |
| Trinidadians and Tobagonians | 0.1 /100 | #281 | Tragic 97.3% |