Immigrants from Kazakhstan vs Brazilian 10th Grade
COMPARE
Immigrants from Kazakhstan
Brazilian
10th Grade
10th Grade Comparison
Immigrants from Kazakhstan
Brazilians
94.1%
10TH GRADE
84.9/ 100
METRIC RATING
144th/ 347
METRIC RANK
93.8%
10TH GRADE
63.6/ 100
METRIC RATING
165th/ 347
METRIC RANK
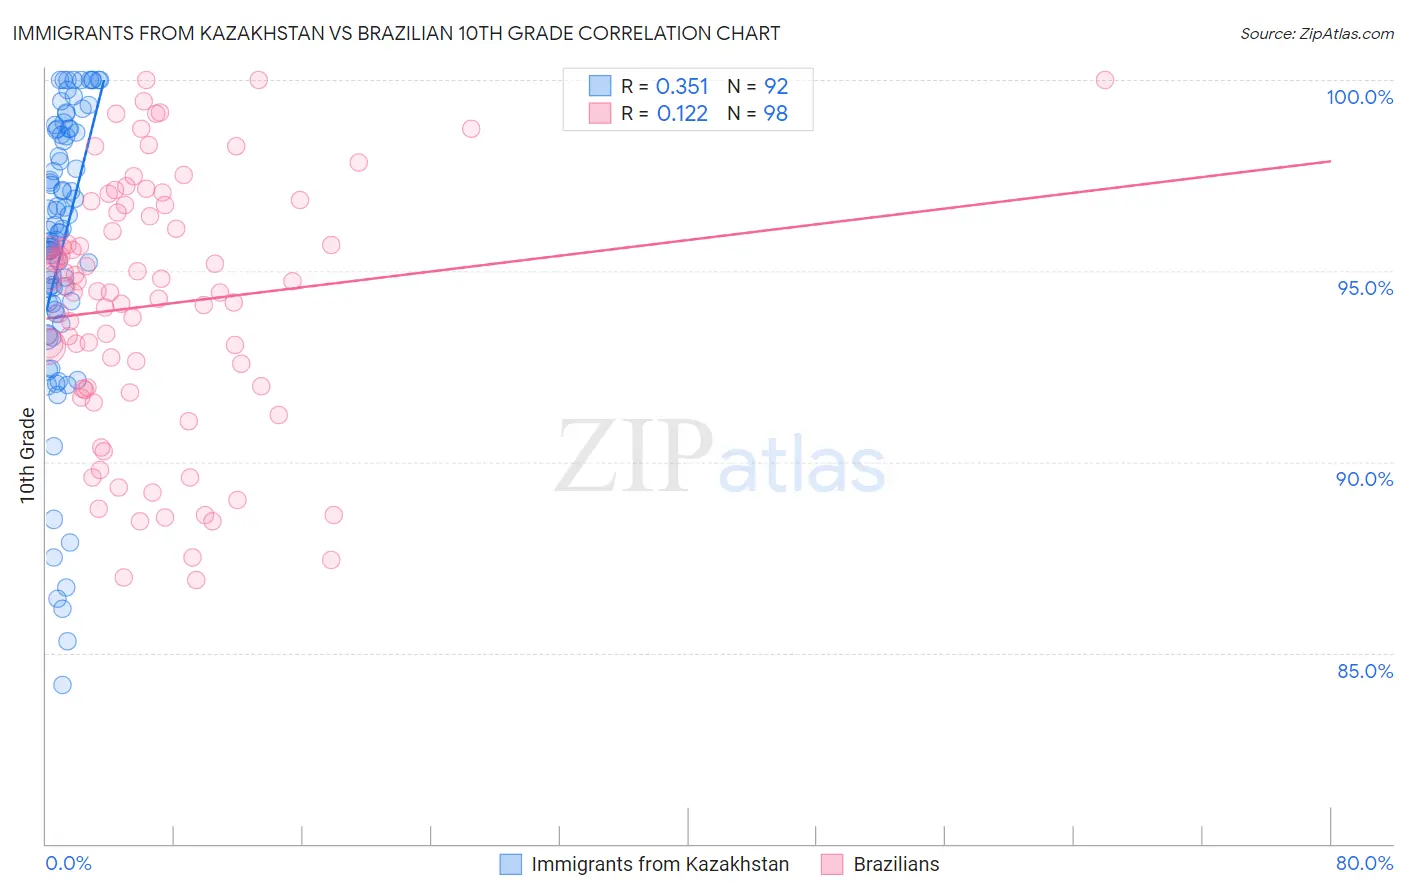
Immigrants from Kazakhstan vs Brazilian 10th Grade Correlation Chart
The statistical analysis conducted on geographies consisting of 124,444,172 people shows a mild positive correlation between the proportion of Immigrants from Kazakhstan and percentage of population with at least 10th grade education in the United States with a correlation coefficient (R) of 0.351 and weighted average of 94.1%. Similarly, the statistical analysis conducted on geographies consisting of 323,900,771 people shows a poor positive correlation between the proportion of Brazilians and percentage of population with at least 10th grade education in the United States with a correlation coefficient (R) of 0.122 and weighted average of 93.8%, a difference of 0.26%.
10th Grade Correlation Summary
| Measurement | Immigrants from Kazakhstan | Brazilian |
| Minimum | 84.1% | 86.9% |
| Maximum | 100.0% | 100.0% |
| Range | 15.9% | 13.1% |
| Mean | 95.6% | 94.1% |
| Median | 96.0% | 94.5% |
| Interquartile 25% (IQ1) | 94.1% | 91.9% |
| Interquartile 75% (IQ3) | 98.7% | 96.5% |
| Interquartile Range (IQR) | 4.6% | 4.6% |
| Standard Deviation (Sample) | 3.7% | 3.3% |
| Standard Deviation (Population) | 3.7% | 3.3% |
Similar Demographics by 10th Grade
Demographics Similar to Immigrants from Kazakhstan by 10th Grade
In terms of 10th grade, the demographic groups most similar to Immigrants from Kazakhstan are Cherokee (94.1%, a difference of 0.0%), Nonimmigrants (94.1%, a difference of 0.020%), Hmong (94.1%, a difference of 0.030%), Albanian (94.1%, a difference of 0.030%), and Chickasaw (94.1%, a difference of 0.040%).
| Demographics | Rating | Rank | 10th Grade |
| Arapaho | 90.5 /100 | #137 | Exceptional 94.2% |
| Immigrants | Sri Lanka | 89.9 /100 | #138 | Excellent 94.2% |
| Immigrants | Bosnia and Herzegovina | 89.4 /100 | #139 | Excellent 94.2% |
| Immigrants | Jordan | 87.6 /100 | #140 | Excellent 94.1% |
| Hmong | 86.6 /100 | #141 | Excellent 94.1% |
| Albanians | 86.5 /100 | #142 | Excellent 94.1% |
| Cherokee | 84.9 /100 | #143 | Excellent 94.1% |
| Immigrants | Kazakhstan | 84.9 /100 | #144 | Excellent 94.1% |
| Immigrants | Nonimmigrants | 83.8 /100 | #145 | Excellent 94.1% |
| Chickasaw | 82.6 /100 | #146 | Excellent 94.1% |
| Immigrants | Ukraine | 81.5 /100 | #147 | Excellent 94.0% |
| Arabs | 80.9 /100 | #148 | Excellent 94.0% |
| Ugandans | 80.7 /100 | #149 | Excellent 94.0% |
| Egyptians | 79.6 /100 | #150 | Good 94.0% |
| Kenyans | 79.1 /100 | #151 | Good 94.0% |
Demographics Similar to Brazilians by 10th Grade
In terms of 10th grade, the demographic groups most similar to Brazilians are Immigrants from Iraq (93.8%, a difference of 0.010%), Immigrants from Egypt (93.8%, a difference of 0.010%), Alsatian (93.8%, a difference of 0.040%), Iraqi (93.9%, a difference of 0.050%), and Assyrian/Chaldean/Syriac (93.9%, a difference of 0.060%).
| Demographics | Rating | Rank | 10th Grade |
| Bermudans | 71.0 /100 | #158 | Good 93.9% |
| Chileans | 70.2 /100 | #159 | Good 93.9% |
| Pakistanis | 70.1 /100 | #160 | Good 93.9% |
| Assyrians/Chaldeans/Syriacs | 69.7 /100 | #161 | Good 93.9% |
| Immigrants | Poland | 69.6 /100 | #162 | Good 93.9% |
| Venezuelans | 69.5 /100 | #163 | Good 93.9% |
| Iraqis | 68.1 /100 | #164 | Good 93.9% |
| Brazilians | 63.6 /100 | #165 | Good 93.8% |
| Immigrants | Iraq | 63.0 /100 | #166 | Good 93.8% |
| Immigrants | Egypt | 62.3 /100 | #167 | Good 93.8% |
| Alsatians | 59.4 /100 | #168 | Average 93.8% |
| Immigrants | Spain | 55.9 /100 | #169 | Average 93.8% |
| Immigrants | Venezuela | 53.9 /100 | #170 | Average 93.8% |
| Immigrants | Albania | 52.4 /100 | #171 | Average 93.8% |
| French American Indians | 50.9 /100 | #172 | Average 93.7% |