Immigrants from Vietnam vs Immigrants from Bulgaria Professional Degree
COMPARE
Immigrants from Vietnam
Immigrants from Bulgaria
Professional Degree
Professional Degree Comparison
Immigrants from Vietnam
Immigrants from Bulgaria
4.0%
PROFESSIONAL DEGREE
9.4/ 100
METRIC RATING
217th/ 347
METRIC RANK
5.5%
PROFESSIONAL DEGREE
99.9/ 100
METRIC RATING
67th/ 347
METRIC RANK
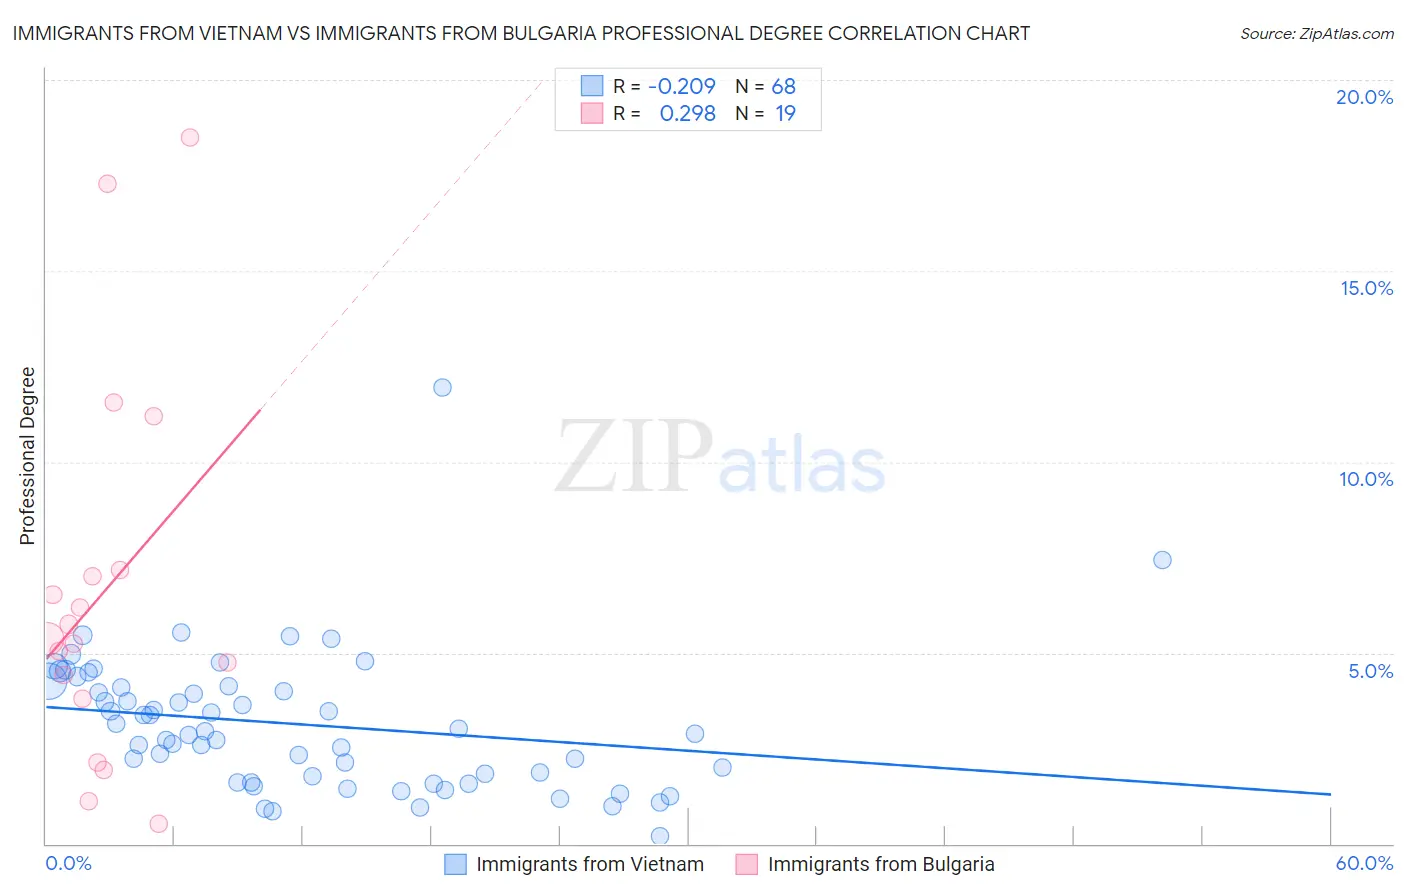
Immigrants from Vietnam vs Immigrants from Bulgaria Professional Degree Correlation Chart
The statistical analysis conducted on geographies consisting of 404,027,110 people shows a weak negative correlation between the proportion of Immigrants from Vietnam and percentage of population with at least professional degree education in the United States with a correlation coefficient (R) of -0.209 and weighted average of 4.0%. Similarly, the statistical analysis conducted on geographies consisting of 172,510,370 people shows a weak positive correlation between the proportion of Immigrants from Bulgaria and percentage of population with at least professional degree education in the United States with a correlation coefficient (R) of 0.298 and weighted average of 5.5%, a difference of 35.3%.
Professional Degree Correlation Summary
| Measurement | Immigrants from Vietnam | Immigrants from Bulgaria |
| Minimum | 0.21% | 0.51% |
| Maximum | 12.0% | 18.5% |
| Range | 11.7% | 18.0% |
| Mean | 3.1% | 6.6% |
| Median | 2.9% | 5.4% |
| Interquartile 25% (IQ1) | 1.7% | 3.8% |
| Interquartile 75% (IQ3) | 4.1% | 7.2% |
| Interquartile Range (IQR) | 2.4% | 3.4% |
| Standard Deviation (Sample) | 1.8% | 4.9% |
| Standard Deviation (Population) | 1.8% | 4.8% |
Similar Demographics by Professional Degree
Demographics Similar to Immigrants from Vietnam by Professional Degree
In terms of professional degree, the demographic groups most similar to Immigrants from Vietnam are West Indian (4.1%, a difference of 0.16%), Dutch (4.0%, a difference of 0.21%), Immigrants from South Eastern Asia (4.0%, a difference of 0.24%), Portuguese (4.1%, a difference of 0.48%), and Immigrants from Ghana (4.1%, a difference of 0.53%).
| Demographics | Rating | Rank | Professional Degree |
| Immigrants | Nigeria | 11.7 /100 | #210 | Poor 4.1% |
| Germans | 11.6 /100 | #211 | Poor 4.1% |
| Whites/Caucasians | 11.2 /100 | #212 | Poor 4.1% |
| Koreans | 10.7 /100 | #213 | Poor 4.1% |
| Immigrants | Ghana | 10.6 /100 | #214 | Poor 4.1% |
| Portuguese | 10.5 /100 | #215 | Poor 4.1% |
| West Indians | 9.8 /100 | #216 | Tragic 4.1% |
| Immigrants | Vietnam | 9.4 /100 | #217 | Tragic 4.0% |
| Dutch | 9.0 /100 | #218 | Tragic 4.0% |
| Immigrants | South Eastern Asia | 8.9 /100 | #219 | Tragic 4.0% |
| Ute | 8.2 /100 | #220 | Tragic 4.0% |
| French Canadians | 8.0 /100 | #221 | Tragic 4.0% |
| Immigrants | Western Africa | 7.5 /100 | #222 | Tragic 4.0% |
| Immigrants | Bosnia and Herzegovina | 7.4 /100 | #223 | Tragic 4.0% |
| Trinidadians and Tobagonians | 7.1 /100 | #224 | Tragic 4.0% |
Demographics Similar to Immigrants from Bulgaria by Professional Degree
In terms of professional degree, the demographic groups most similar to Immigrants from Bulgaria are Immigrants from Lebanon (5.5%, a difference of 0.18%), Immigrants from Hungary (5.5%, a difference of 0.26%), Immigrants from Kazakhstan (5.5%, a difference of 0.32%), Immigrants from Bolivia (5.5%, a difference of 0.56%), and Bhutanese (5.4%, a difference of 0.59%).
| Demographics | Rating | Rank | Professional Degree |
| Bolivians | 99.9 /100 | #60 | Exceptional 5.6% |
| Immigrants | Lithuania | 99.9 /100 | #61 | Exceptional 5.6% |
| Immigrants | Belarus | 99.9 /100 | #62 | Exceptional 5.5% |
| Asians | 99.9 /100 | #63 | Exceptional 5.5% |
| Immigrants | Asia | 99.9 /100 | #64 | Exceptional 5.5% |
| Immigrants | Bolivia | 99.9 /100 | #65 | Exceptional 5.5% |
| Immigrants | Kazakhstan | 99.9 /100 | #66 | Exceptional 5.5% |
| Immigrants | Bulgaria | 99.9 /100 | #67 | Exceptional 5.5% |
| Immigrants | Lebanon | 99.9 /100 | #68 | Exceptional 5.5% |
| Immigrants | Hungary | 99.9 /100 | #69 | Exceptional 5.5% |
| Bhutanese | 99.8 /100 | #70 | Exceptional 5.4% |
| Immigrants | Western Asia | 99.8 /100 | #71 | Exceptional 5.4% |
| Lithuanians | 99.8 /100 | #72 | Exceptional 5.4% |
| Immigrants | Romania | 99.8 /100 | #73 | Exceptional 5.4% |
| Ethiopians | 99.7 /100 | #74 | Exceptional 5.4% |