Immigrants from Jordan vs Immigrants from Sweden 1st Grade
COMPARE
Immigrants from Jordan
Immigrants from Sweden
1st Grade
1st Grade Comparison
Immigrants from Jordan
Immigrants from Sweden
97.9%
1ST GRADE
53.9/ 100
METRIC RATING
171st/ 347
METRIC RANK
98.3%
1ST GRADE
99.1/ 100
METRIC RATING
83rd/ 347
METRIC RANK
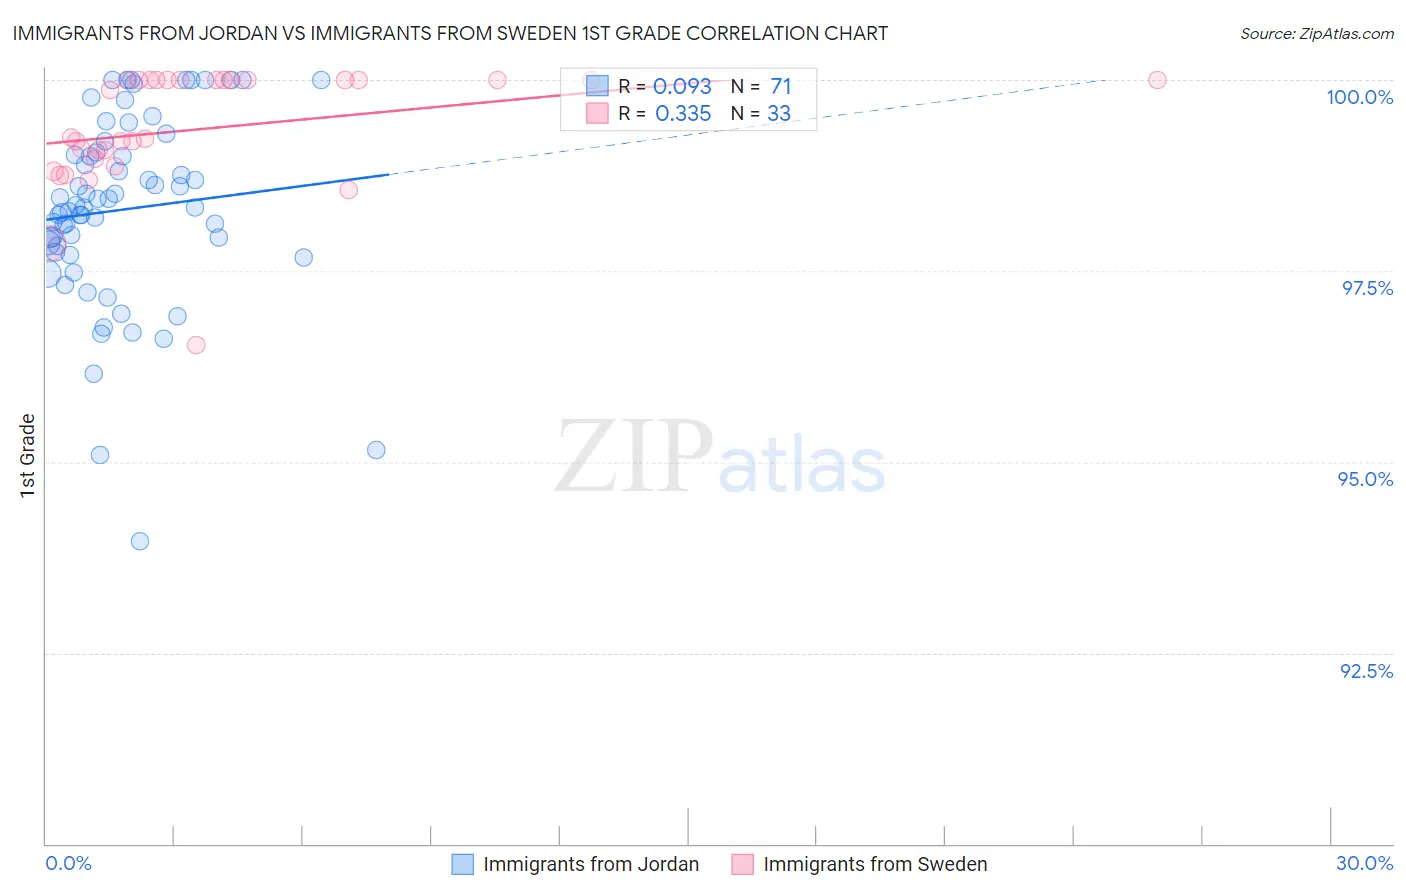
Immigrants from Jordan vs Immigrants from Sweden 1st Grade Correlation Chart
The statistical analysis conducted on geographies consisting of 181,269,915 people shows a slight positive correlation between the proportion of Immigrants from Jordan and percentage of population with at least 1st grade education in the United States with a correlation coefficient (R) of 0.093 and weighted average of 97.9%. Similarly, the statistical analysis conducted on geographies consisting of 164,737,092 people shows a mild positive correlation between the proportion of Immigrants from Sweden and percentage of population with at least 1st grade education in the United States with a correlation coefficient (R) of 0.335 and weighted average of 98.3%, a difference of 0.35%.
1st Grade Correlation Summary
| Measurement | Immigrants from Jordan | Immigrants from Sweden |
| Minimum | 94.0% | 96.5% |
| Maximum | 100.0% | 100.0% |
| Range | 6.0% | 3.5% |
| Mean | 98.3% | 99.4% |
| Median | 98.3% | 99.2% |
| Interquartile 25% (IQ1) | 97.7% | 98.9% |
| Interquartile 75% (IQ3) | 99.1% | 100.0% |
| Interquartile Range (IQR) | 1.3% | 1.1% |
| Standard Deviation (Sample) | 1.2% | 0.78% |
| Standard Deviation (Population) | 1.2% | 0.77% |
Similar Demographics by 1st Grade
Demographics Similar to Immigrants from Jordan by 1st Grade
In terms of 1st grade, the demographic groups most similar to Immigrants from Jordan are Immigrants from Micronesia (97.9%, a difference of 0.0%), Immigrants from Spain (97.9%, a difference of 0.0%), Immigrants from Korea (97.9%, a difference of 0.0%), Brazilian (97.9%, a difference of 0.010%), and Ugandan (97.9%, a difference of 0.010%).
| Demographics | Rating | Rank | 1st Grade |
| Brazilians | 57.6 /100 | #164 | Average 97.9% |
| Ugandans | 56.9 /100 | #165 | Average 97.9% |
| Navajo | 56.6 /100 | #166 | Average 97.9% |
| Bermudans | 56.3 /100 | #167 | Average 97.9% |
| Chileans | 55.6 /100 | #168 | Average 97.9% |
| Immigrants | Micronesia | 55.3 /100 | #169 | Average 97.9% |
| Immigrants | Spain | 54.9 /100 | #170 | Average 97.9% |
| Immigrants | Jordan | 53.9 /100 | #171 | Average 97.9% |
| Immigrants | Korea | 53.0 /100 | #172 | Average 97.9% |
| Kenyans | 51.2 /100 | #173 | Average 97.9% |
| Natives/Alaskans | 50.0 /100 | #174 | Average 97.9% |
| Immigrants | Sri Lanka | 49.7 /100 | #175 | Average 97.9% |
| Albanians | 49.6 /100 | #176 | Average 97.9% |
| Immigrants | Brazil | 49.1 /100 | #177 | Average 97.9% |
| Immigrants | Venezuela | 47.8 /100 | #178 | Average 97.9% |
Demographics Similar to Immigrants from Sweden by 1st Grade
In terms of 1st grade, the demographic groups most similar to Immigrants from Sweden are Delaware (98.3%, a difference of 0.0%), Hopi (98.3%, a difference of 0.0%), Immigrants from Denmark (98.3%, a difference of 0.0%), Immigrants from Belgium (98.3%, a difference of 0.010%), and Immigrants from Lithuania (98.3%, a difference of 0.010%).
| Demographics | Rating | Rank | 1st Grade |
| Shoshone | 99.3 /100 | #76 | Exceptional 98.3% |
| Immigrants | England | 99.3 /100 | #77 | Exceptional 98.3% |
| Immigrants | Belgium | 99.2 /100 | #78 | Exceptional 98.3% |
| Immigrants | Lithuania | 99.2 /100 | #79 | Exceptional 98.3% |
| Osage | 99.2 /100 | #80 | Exceptional 98.3% |
| Potawatomi | 99.1 /100 | #81 | Exceptional 98.3% |
| Icelanders | 99.1 /100 | #82 | Exceptional 98.3% |
| Immigrants | Sweden | 99.1 /100 | #83 | Exceptional 98.3% |
| Delaware | 99.1 /100 | #84 | Exceptional 98.3% |
| Hopi | 99.0 /100 | #85 | Exceptional 98.3% |
| Immigrants | Denmark | 99.0 /100 | #86 | Exceptional 98.3% |
| Immigrants | Australia | 99.0 /100 | #87 | Exceptional 98.3% |
| Zimbabweans | 98.9 /100 | #88 | Exceptional 98.3% |
| Immigrants | South Africa | 98.8 /100 | #89 | Exceptional 98.3% |
| Ukrainians | 98.8 /100 | #90 | Exceptional 98.3% |