Immigrants from Jordan vs Immigrants from Pakistan 1st Grade
COMPARE
Immigrants from Jordan
Immigrants from Pakistan
1st Grade
1st Grade Comparison
Immigrants from Jordan
Immigrants from Pakistan
97.9%
1ST GRADE
53.9/ 100
METRIC RATING
171st/ 347
METRIC RANK
97.6%
1ST GRADE
2.2/ 100
METRIC RATING
233rd/ 347
METRIC RANK
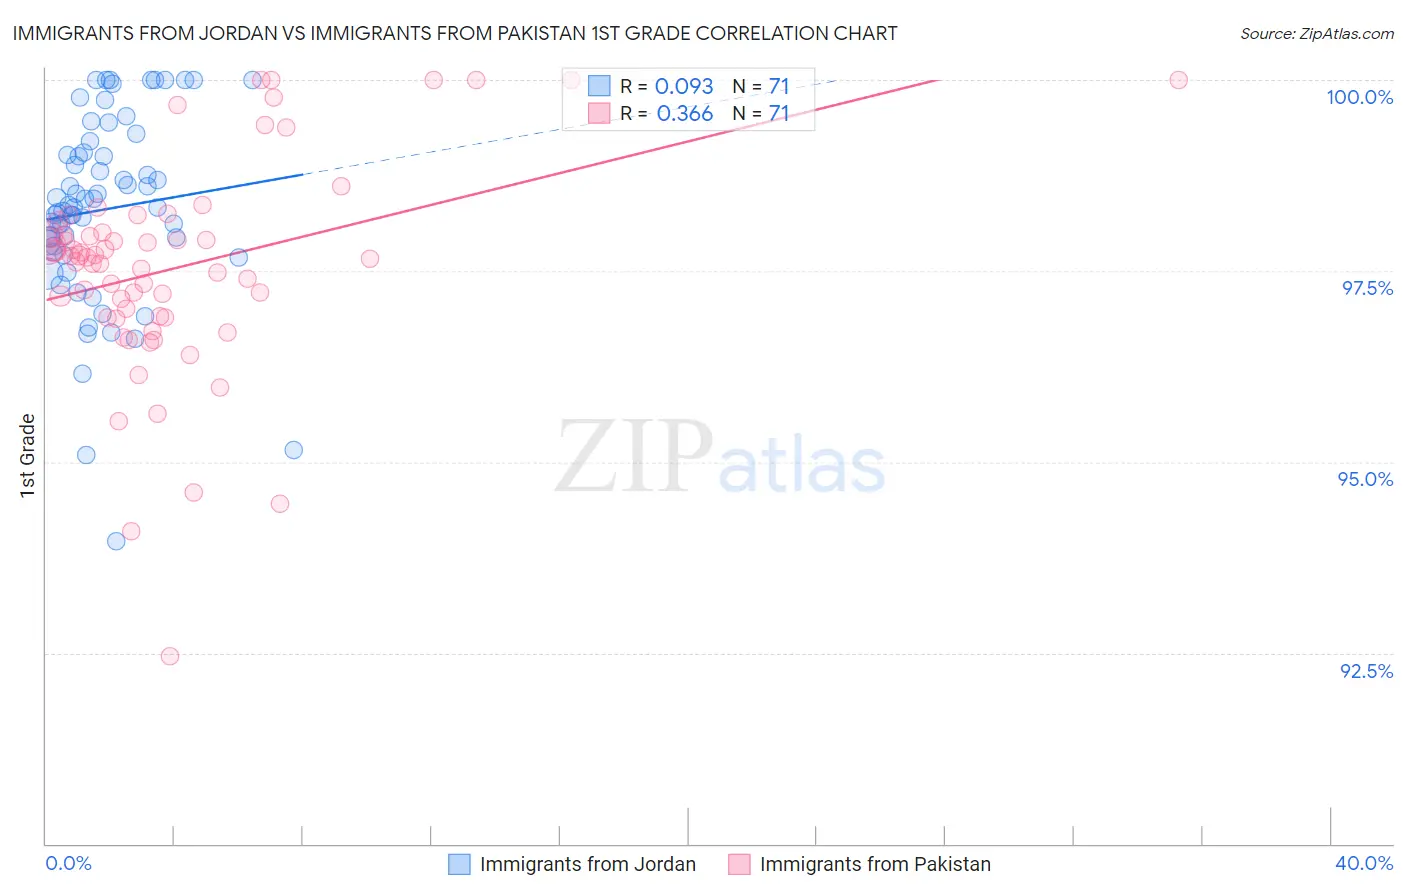
Immigrants from Jordan vs Immigrants from Pakistan 1st Grade Correlation Chart
The statistical analysis conducted on geographies consisting of 181,269,915 people shows a slight positive correlation between the proportion of Immigrants from Jordan and percentage of population with at least 1st grade education in the United States with a correlation coefficient (R) of 0.093 and weighted average of 97.9%. Similarly, the statistical analysis conducted on geographies consisting of 283,900,935 people shows a mild positive correlation between the proportion of Immigrants from Pakistan and percentage of population with at least 1st grade education in the United States with a correlation coefficient (R) of 0.366 and weighted average of 97.6%, a difference of 0.31%.
1st Grade Correlation Summary
| Measurement | Immigrants from Jordan | Immigrants from Pakistan |
| Minimum | 94.0% | 92.5% |
| Maximum | 100.0% | 100.0% |
| Range | 6.0% | 7.5% |
| Mean | 98.3% | 97.5% |
| Median | 98.3% | 97.7% |
| Interquartile 25% (IQ1) | 97.7% | 96.9% |
| Interquartile 75% (IQ3) | 99.1% | 98.0% |
| Interquartile Range (IQR) | 1.3% | 1.1% |
| Standard Deviation (Sample) | 1.2% | 1.4% |
| Standard Deviation (Population) | 1.2% | 1.4% |
Similar Demographics by 1st Grade
Demographics Similar to Immigrants from Jordan by 1st Grade
In terms of 1st grade, the demographic groups most similar to Immigrants from Jordan are Immigrants from Micronesia (97.9%, a difference of 0.0%), Immigrants from Spain (97.9%, a difference of 0.0%), Immigrants from Korea (97.9%, a difference of 0.0%), Brazilian (97.9%, a difference of 0.010%), and Ugandan (97.9%, a difference of 0.010%).
| Demographics | Rating | Rank | 1st Grade |
| Brazilians | 57.6 /100 | #164 | Average 97.9% |
| Ugandans | 56.9 /100 | #165 | Average 97.9% |
| Navajo | 56.6 /100 | #166 | Average 97.9% |
| Bermudans | 56.3 /100 | #167 | Average 97.9% |
| Chileans | 55.6 /100 | #168 | Average 97.9% |
| Immigrants | Micronesia | 55.3 /100 | #169 | Average 97.9% |
| Immigrants | Spain | 54.9 /100 | #170 | Average 97.9% |
| Immigrants | Jordan | 53.9 /100 | #171 | Average 97.9% |
| Immigrants | Korea | 53.0 /100 | #172 | Average 97.9% |
| Kenyans | 51.2 /100 | #173 | Average 97.9% |
| Natives/Alaskans | 50.0 /100 | #174 | Average 97.9% |
| Immigrants | Sri Lanka | 49.7 /100 | #175 | Average 97.9% |
| Albanians | 49.6 /100 | #176 | Average 97.9% |
| Immigrants | Brazil | 49.1 /100 | #177 | Average 97.9% |
| Immigrants | Venezuela | 47.8 /100 | #178 | Average 97.9% |
Demographics Similar to Immigrants from Pakistan by 1st Grade
In terms of 1st grade, the demographic groups most similar to Immigrants from Pakistan are Colombian (97.6%, a difference of 0.0%), Immigrants from Malaysia (97.6%, a difference of 0.0%), Immigrants from Western Asia (97.6%, a difference of 0.0%), Immigrants from Uruguay (97.6%, a difference of 0.010%), and U.S. Virgin Islander (97.6%, a difference of 0.010%).
| Demographics | Rating | Rank | 1st Grade |
| Sudanese | 3.7 /100 | #226 | Tragic 97.7% |
| Sierra Leoneans | 3.6 /100 | #227 | Tragic 97.7% |
| Sub-Saharan Africans | 3.6 /100 | #228 | Tragic 97.7% |
| Immigrants | Costa Rica | 3.5 /100 | #229 | Tragic 97.7% |
| Senegalese | 3.5 /100 | #230 | Tragic 97.7% |
| Puerto Ricans | 3.0 /100 | #231 | Tragic 97.7% |
| Immigrants | Uruguay | 2.5 /100 | #232 | Tragic 97.6% |
| Immigrants | Pakistan | 2.2 /100 | #233 | Tragic 97.6% |
| Colombians | 2.2 /100 | #234 | Tragic 97.6% |
| Immigrants | Malaysia | 2.1 /100 | #235 | Tragic 97.6% |
| Immigrants | Western Asia | 2.1 /100 | #236 | Tragic 97.6% |
| U.S. Virgin Islanders | 1.9 /100 | #237 | Tragic 97.6% |
| Nigerians | 1.8 /100 | #238 | Tragic 97.6% |
| Immigrants | Eastern Asia | 1.6 /100 | #239 | Tragic 97.6% |
| Koreans | 1.5 /100 | #240 | Tragic 97.6% |