Immigrants from Jordan vs Immigrants from Germany 1st Grade
COMPARE
Immigrants from Jordan
Immigrants from Germany
1st Grade
1st Grade Comparison
Immigrants from Jordan
Immigrants from Germany
97.9%
1ST GRADE
53.9/ 100
METRIC RATING
171st/ 347
METRIC RANK
98.2%
1ST GRADE
98.5/ 100
METRIC RATING
95th/ 347
METRIC RANK
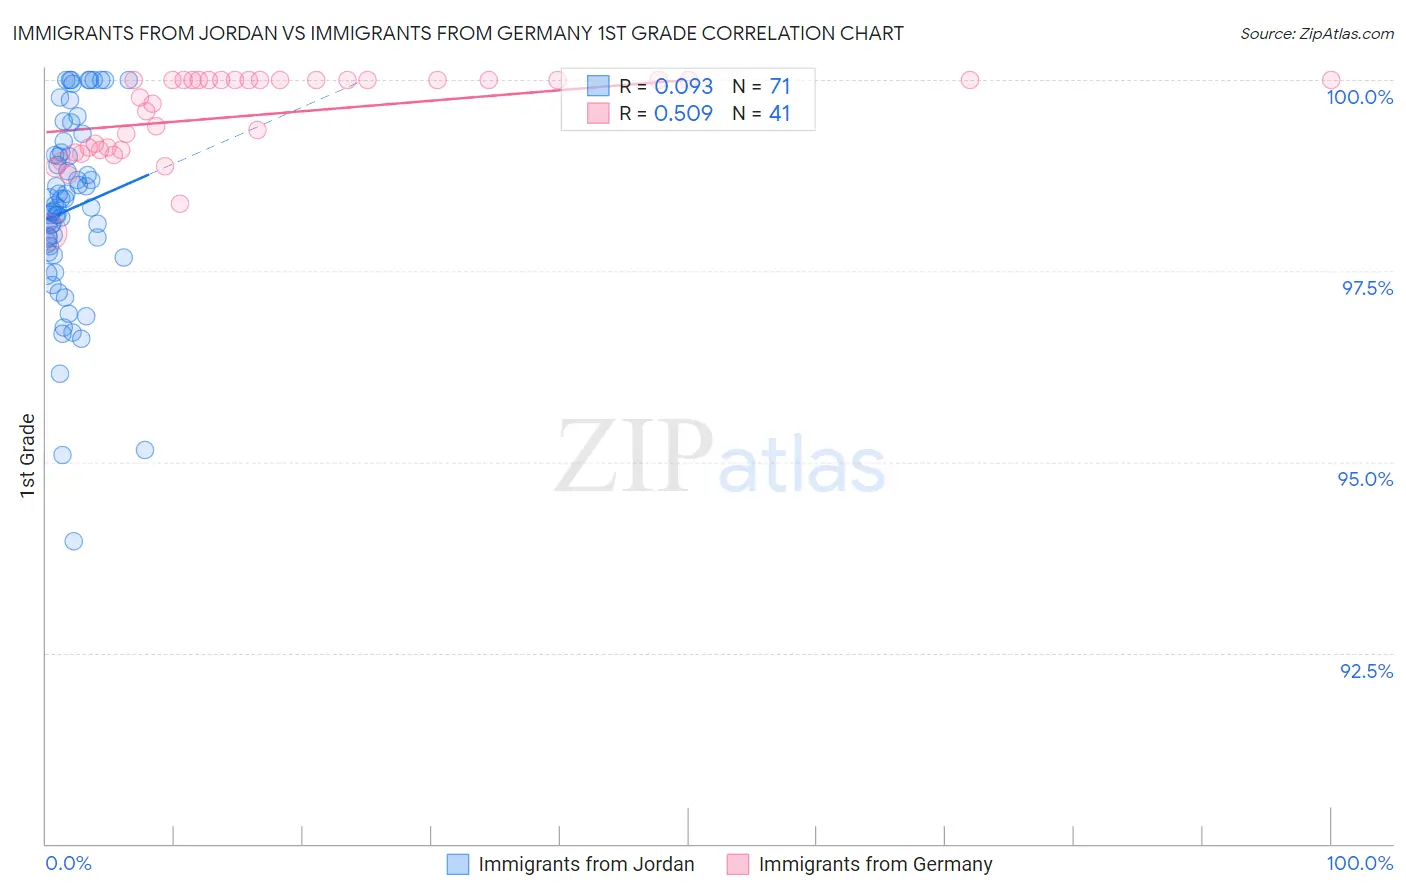
Immigrants from Jordan vs Immigrants from Germany 1st Grade Correlation Chart
The statistical analysis conducted on geographies consisting of 181,269,915 people shows a slight positive correlation between the proportion of Immigrants from Jordan and percentage of population with at least 1st grade education in the United States with a correlation coefficient (R) of 0.093 and weighted average of 97.9%. Similarly, the statistical analysis conducted on geographies consisting of 463,886,643 people shows a substantial positive correlation between the proportion of Immigrants from Germany and percentage of population with at least 1st grade education in the United States with a correlation coefficient (R) of 0.509 and weighted average of 98.2%, a difference of 0.31%.
1st Grade Correlation Summary
| Measurement | Immigrants from Jordan | Immigrants from Germany |
| Minimum | 94.0% | 98.0% |
| Maximum | 100.0% | 100.0% |
| Range | 6.0% | 2.0% |
| Mean | 98.3% | 99.6% |
| Median | 98.3% | 100.0% |
| Interquartile 25% (IQ1) | 97.7% | 99.1% |
| Interquartile 75% (IQ3) | 99.1% | 100.0% |
| Interquartile Range (IQR) | 1.3% | 0.91% |
| Standard Deviation (Sample) | 1.2% | 0.55% |
| Standard Deviation (Population) | 1.2% | 0.54% |
Similar Demographics by 1st Grade
Demographics Similar to Immigrants from Jordan by 1st Grade
In terms of 1st grade, the demographic groups most similar to Immigrants from Jordan are Immigrants from Micronesia (97.9%, a difference of 0.0%), Immigrants from Spain (97.9%, a difference of 0.0%), Immigrants from Korea (97.9%, a difference of 0.0%), Brazilian (97.9%, a difference of 0.010%), and Ugandan (97.9%, a difference of 0.010%).
| Demographics | Rating | Rank | 1st Grade |
| Brazilians | 57.6 /100 | #164 | Average 97.9% |
| Ugandans | 56.9 /100 | #165 | Average 97.9% |
| Navajo | 56.6 /100 | #166 | Average 97.9% |
| Bermudans | 56.3 /100 | #167 | Average 97.9% |
| Chileans | 55.6 /100 | #168 | Average 97.9% |
| Immigrants | Micronesia | 55.3 /100 | #169 | Average 97.9% |
| Immigrants | Spain | 54.9 /100 | #170 | Average 97.9% |
| Immigrants | Jordan | 53.9 /100 | #171 | Average 97.9% |
| Immigrants | Korea | 53.0 /100 | #172 | Average 97.9% |
| Kenyans | 51.2 /100 | #173 | Average 97.9% |
| Natives/Alaskans | 50.0 /100 | #174 | Average 97.9% |
| Immigrants | Sri Lanka | 49.7 /100 | #175 | Average 97.9% |
| Albanians | 49.6 /100 | #176 | Average 97.9% |
| Immigrants | Brazil | 49.1 /100 | #177 | Average 97.9% |
| Immigrants | Venezuela | 47.8 /100 | #178 | Average 97.9% |
Demographics Similar to Immigrants from Germany by 1st Grade
In terms of 1st grade, the demographic groups most similar to Immigrants from Germany are Immigrants from India (98.2%, a difference of 0.0%), South African (98.2%, a difference of 0.0%), Immigrants from Western Europe (98.3%, a difference of 0.010%), Macedonian (98.3%, a difference of 0.010%), and Cypriot (98.2%, a difference of 0.010%).
| Demographics | Rating | Rank | 1st Grade |
| Zimbabweans | 98.9 /100 | #88 | Exceptional 98.3% |
| Immigrants | South Africa | 98.8 /100 | #89 | Exceptional 98.3% |
| Ukrainians | 98.8 /100 | #90 | Exceptional 98.3% |
| Immigrants | Western Europe | 98.8 /100 | #91 | Exceptional 98.3% |
| Macedonians | 98.7 /100 | #92 | Exceptional 98.3% |
| Immigrants | India | 98.6 /100 | #93 | Exceptional 98.2% |
| South Africans | 98.6 /100 | #94 | Exceptional 98.2% |
| Immigrants | Germany | 98.5 /100 | #95 | Exceptional 98.2% |
| Cypriots | 98.3 /100 | #96 | Exceptional 98.2% |
| Immigrants | Nonimmigrants | 98.3 /100 | #97 | Exceptional 98.2% |
| Choctaw | 98.3 /100 | #98 | Exceptional 98.2% |
| Puget Sound Salish | 98.2 /100 | #99 | Exceptional 98.2% |
| Colville | 98.0 /100 | #100 | Exceptional 98.2% |
| Romanians | 97.8 /100 | #101 | Exceptional 98.2% |
| Cree | 97.8 /100 | #102 | Exceptional 98.2% |