Immigrants from Dominica vs Assyrian/Chaldean/Syriac 11th Grade
COMPARE
Immigrants from Dominica
Assyrian/Chaldean/Syriac
11th Grade
11th Grade Comparison
Immigrants from Dominica
Assyrians/Chaldeans/Syriacs
89.5%
11TH GRADE
0.0/ 100
METRIC RATING
307th/ 347
METRIC RANK
92.8%
11TH GRADE
80.5/ 100
METRIC RATING
144th/ 347
METRIC RANK
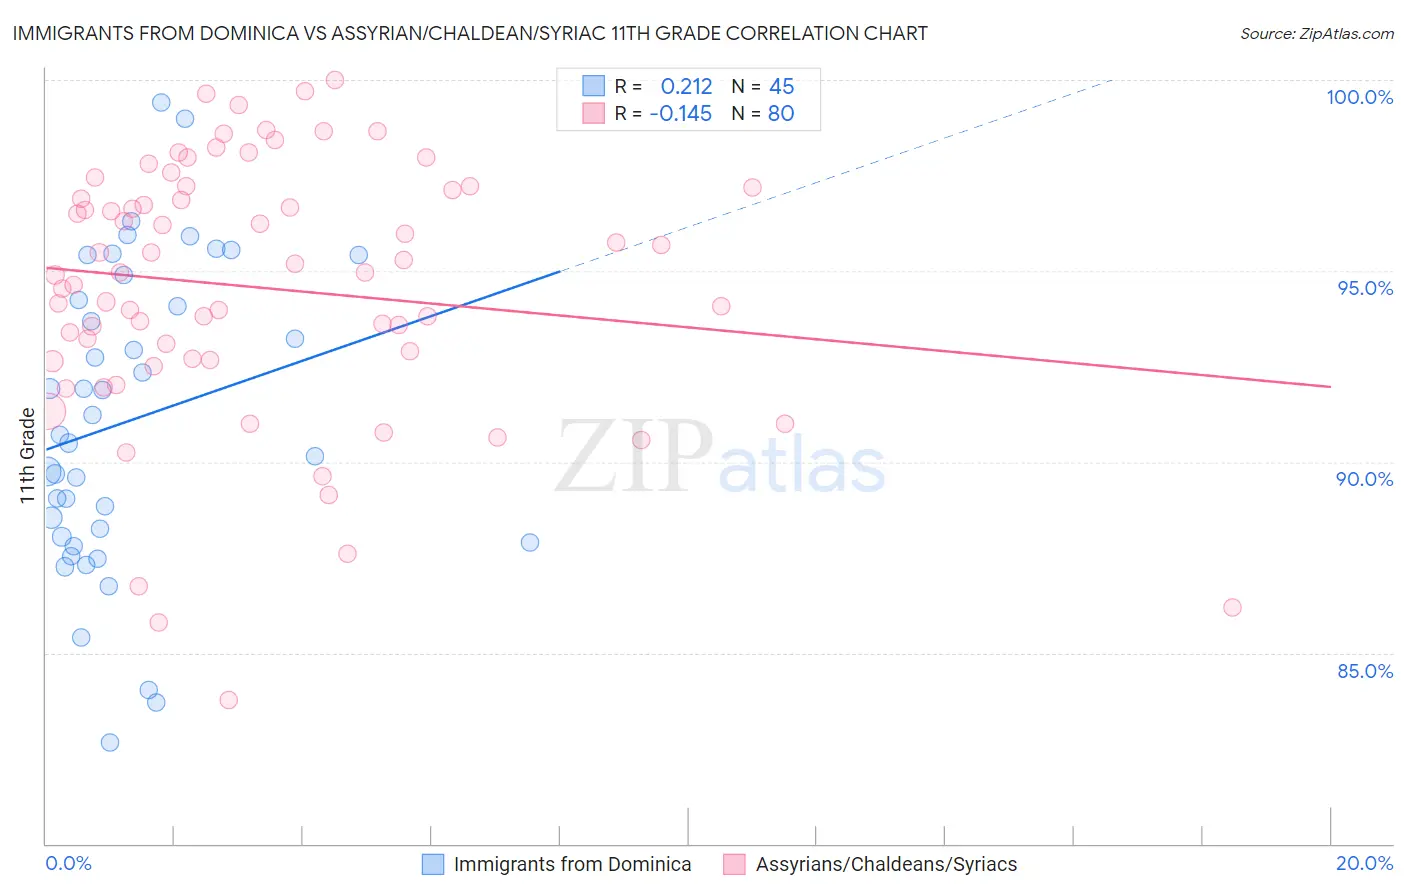
Immigrants from Dominica vs Assyrian/Chaldean/Syriac 11th Grade Correlation Chart
The statistical analysis conducted on geographies consisting of 83,794,115 people shows a weak positive correlation between the proportion of Immigrants from Dominica and percentage of population with at least 11th grade education in the United States with a correlation coefficient (R) of 0.212 and weighted average of 89.5%. Similarly, the statistical analysis conducted on geographies consisting of 110,318,125 people shows a poor negative correlation between the proportion of Assyrians/Chaldeans/Syriacs and percentage of population with at least 11th grade education in the United States with a correlation coefficient (R) of -0.145 and weighted average of 92.8%, a difference of 3.7%.
11th Grade Correlation Summary
| Measurement | Immigrants from Dominica | Assyrian/Chaldean/Syriac |
| Minimum | 82.7% | 83.8% |
| Maximum | 99.4% | 100.0% |
| Range | 16.7% | 16.2% |
| Mean | 91.1% | 94.6% |
| Median | 90.7% | 95.0% |
| Interquartile 25% (IQ1) | 88.0% | 92.7% |
| Interquartile 75% (IQ3) | 94.6% | 97.1% |
| Interquartile Range (IQR) | 6.6% | 4.5% |
| Standard Deviation (Sample) | 4.0% | 3.4% |
| Standard Deviation (Population) | 4.0% | 3.4% |
Similar Demographics by 11th Grade
Demographics Similar to Immigrants from Dominica by 11th Grade
In terms of 11th grade, the demographic groups most similar to Immigrants from Dominica are Nepalese (89.5%, a difference of 0.020%), Immigrants from Bangladesh (89.5%, a difference of 0.040%), Ecuadorian (89.6%, a difference of 0.050%), Yaqui (89.5%, a difference of 0.060%), and Immigrants from Cambodia (89.6%, a difference of 0.10%).
| Demographics | Rating | Rank | 11th Grade |
| Immigrants | Haiti | 0.0 /100 | #300 | Tragic 89.9% |
| Guyanese | 0.0 /100 | #301 | Tragic 89.9% |
| Immigrants | Guyana | 0.0 /100 | #302 | Tragic 89.7% |
| Immigrants | Immigrants | 0.0 /100 | #303 | Tragic 89.7% |
| Yuman | 0.0 /100 | #304 | Tragic 89.7% |
| Immigrants | Cambodia | 0.0 /100 | #305 | Tragic 89.6% |
| Ecuadorians | 0.0 /100 | #306 | Tragic 89.6% |
| Immigrants | Dominica | 0.0 /100 | #307 | Tragic 89.5% |
| Nepalese | 0.0 /100 | #308 | Tragic 89.5% |
| Immigrants | Bangladesh | 0.0 /100 | #309 | Tragic 89.5% |
| Yaqui | 0.0 /100 | #310 | Tragic 89.5% |
| Vietnamese | 0.0 /100 | #311 | Tragic 89.4% |
| Immigrants | Portugal | 0.0 /100 | #312 | Tragic 89.3% |
| Immigrants | Caribbean | 0.0 /100 | #313 | Tragic 89.1% |
| Cape Verdeans | 0.0 /100 | #314 | Tragic 89.1% |
Demographics Similar to Assyrians/Chaldeans/Syriacs by 11th Grade
In terms of 11th grade, the demographic groups most similar to Assyrians/Chaldeans/Syriacs are Pakistani (92.8%, a difference of 0.010%), Ugandan (92.9%, a difference of 0.020%), Iroquois (92.8%, a difference of 0.020%), Kenyan (92.9%, a difference of 0.030%), and Immigrants from Kenya (92.8%, a difference of 0.030%).
| Demographics | Rating | Rank | 11th Grade |
| Arabs | 85.4 /100 | #137 | Excellent 92.9% |
| Immigrants | Brazil | 85.1 /100 | #138 | Excellent 92.9% |
| Crow | 84.1 /100 | #139 | Excellent 92.9% |
| Venezuelans | 83.4 /100 | #140 | Excellent 92.9% |
| Chileans | 83.0 /100 | #141 | Excellent 92.9% |
| Kenyans | 82.0 /100 | #142 | Excellent 92.9% |
| Ugandans | 81.4 /100 | #143 | Excellent 92.9% |
| Assyrians/Chaldeans/Syriacs | 80.5 /100 | #144 | Excellent 92.8% |
| Pakistanis | 79.6 /100 | #145 | Good 92.8% |
| Iroquois | 79.1 /100 | #146 | Good 92.8% |
| Immigrants | Kenya | 78.7 /100 | #147 | Good 92.8% |
| Hmong | 78.6 /100 | #148 | Good 92.8% |
| Immigrants | Poland | 78.5 /100 | #149 | Good 92.8% |
| Immigrants | Egypt | 77.5 /100 | #150 | Good 92.8% |
| Potawatomi | 74.3 /100 | #151 | Good 92.8% |