Immigrants from Portugal vs Spanish American Indian 11th Grade
COMPARE
Immigrants from Portugal
Spanish American Indian
11th Grade
11th Grade Comparison
Immigrants from Portugal
Spanish American Indians
89.3%
11TH GRADE
0.0/ 100
METRIC RATING
312th/ 347
METRIC RANK
84.7%
11TH GRADE
0.0/ 100
METRIC RATING
346th/ 347
METRIC RANK
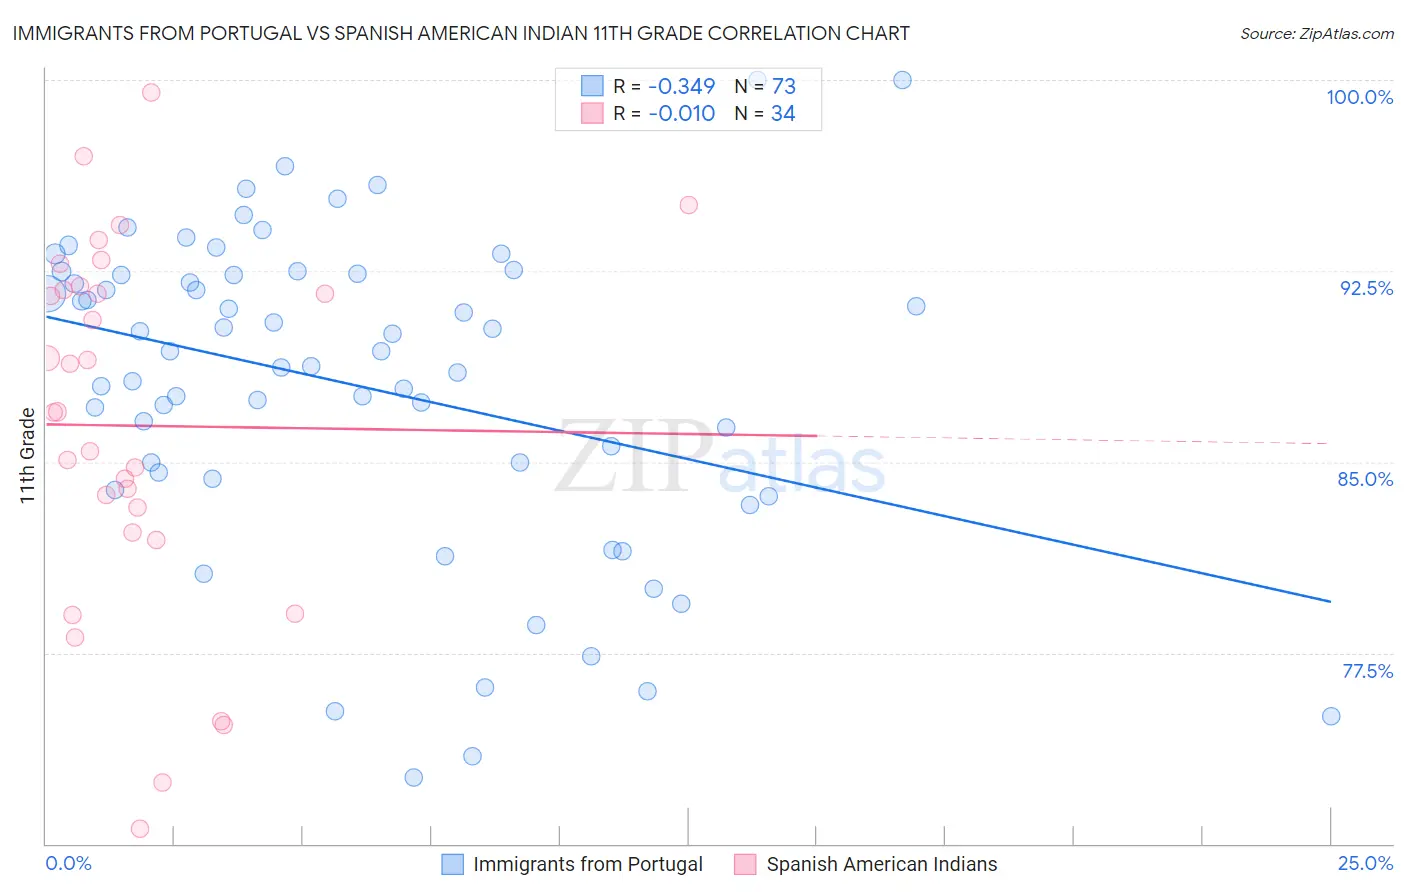
Immigrants from Portugal vs Spanish American Indian 11th Grade Correlation Chart
The statistical analysis conducted on geographies consisting of 174,792,107 people shows a mild negative correlation between the proportion of Immigrants from Portugal and percentage of population with at least 11th grade education in the United States with a correlation coefficient (R) of -0.349 and weighted average of 89.3%. Similarly, the statistical analysis conducted on geographies consisting of 73,147,813 people shows no correlation between the proportion of Spanish American Indians and percentage of population with at least 11th grade education in the United States with a correlation coefficient (R) of -0.010 and weighted average of 84.7%, a difference of 5.3%.
11th Grade Correlation Summary
| Measurement | Immigrants from Portugal | Spanish American Indian |
| Minimum | 72.6% | 70.6% |
| Maximum | 100.0% | 99.5% |
| Range | 27.4% | 29.0% |
| Mean | 88.0% | 86.4% |
| Median | 89.3% | 87.0% |
| Interquartile 25% (IQ1) | 84.4% | 82.2% |
| Interquartile 75% (IQ3) | 92.4% | 91.7% |
| Interquartile Range (IQR) | 7.9% | 9.5% |
| Standard Deviation (Sample) | 6.2% | 7.2% |
| Standard Deviation (Population) | 6.2% | 7.1% |
Similar Demographics by 11th Grade
Demographics Similar to Immigrants from Portugal by 11th Grade
In terms of 11th grade, the demographic groups most similar to Immigrants from Portugal are Vietnamese (89.4%, a difference of 0.18%), Immigrants from Caribbean (89.1%, a difference of 0.20%), Cape Verdean (89.1%, a difference of 0.22%), Immigrants from Ecuador (89.1%, a difference of 0.23%), and Yaqui (89.5%, a difference of 0.24%).
| Demographics | Rating | Rank | 11th Grade |
| Immigrants | Cambodia | 0.0 /100 | #305 | Tragic 89.6% |
| Ecuadorians | 0.0 /100 | #306 | Tragic 89.6% |
| Immigrants | Dominica | 0.0 /100 | #307 | Tragic 89.5% |
| Nepalese | 0.0 /100 | #308 | Tragic 89.5% |
| Immigrants | Bangladesh | 0.0 /100 | #309 | Tragic 89.5% |
| Yaqui | 0.0 /100 | #310 | Tragic 89.5% |
| Vietnamese | 0.0 /100 | #311 | Tragic 89.4% |
| Immigrants | Portugal | 0.0 /100 | #312 | Tragic 89.3% |
| Immigrants | Caribbean | 0.0 /100 | #313 | Tragic 89.1% |
| Cape Verdeans | 0.0 /100 | #314 | Tragic 89.1% |
| Immigrants | Ecuador | 0.0 /100 | #315 | Tragic 89.1% |
| Immigrants | Cuba | 0.0 /100 | #316 | Tragic 88.9% |
| Lumbee | 0.0 /100 | #317 | Tragic 88.9% |
| Nicaraguans | 0.0 /100 | #318 | Tragic 88.9% |
| Belizeans | 0.0 /100 | #319 | Tragic 88.8% |
Demographics Similar to Spanish American Indians by 11th Grade
In terms of 11th grade, the demographic groups most similar to Spanish American Indians are Immigrants from Central America (84.9%, a difference of 0.24%), Yakama (85.0%, a difference of 0.27%), Immigrants from Mexico (84.5%, a difference of 0.30%), Immigrants from El Salvador (85.3%, a difference of 0.68%), and Immigrants from Guatemala (85.8%, a difference of 1.3%).
| Demographics | Rating | Rank | 11th Grade |
| Immigrants | Yemen | 0.0 /100 | #333 | Tragic 87.1% |
| Houma | 0.0 /100 | #334 | Tragic 87.0% |
| Central Americans | 0.0 /100 | #335 | Tragic 86.9% |
| Immigrants | Dominican Republic | 0.0 /100 | #336 | Tragic 86.9% |
| Immigrants | Honduras | 0.0 /100 | #337 | Tragic 86.9% |
| Immigrants | Latin America | 0.0 /100 | #338 | Tragic 86.8% |
| Guatemalans | 0.0 /100 | #339 | Tragic 86.4% |
| Salvadorans | 0.0 /100 | #340 | Tragic 86.2% |
| Mexicans | 0.0 /100 | #341 | Tragic 86.1% |
| Immigrants | Guatemala | 0.0 /100 | #342 | Tragic 85.8% |
| Immigrants | El Salvador | 0.0 /100 | #343 | Tragic 85.3% |
| Yakama | 0.0 /100 | #344 | Tragic 85.0% |
| Immigrants | Central America | 0.0 /100 | #345 | Tragic 84.9% |
| Spanish American Indians | 0.0 /100 | #346 | Tragic 84.7% |
| Immigrants | Mexico | 0.0 /100 | #347 | Tragic 84.5% |