Immigrants from Japan vs Estonian Doctorate Degree
COMPARE
Immigrants from Japan
Estonian
Doctorate Degree
Doctorate Degree Comparison
Immigrants from Japan
Estonians
2.8%
DOCTORATE DEGREE
100.0/ 100
METRIC RATING
19th/ 347
METRIC RANK
2.5%
DOCTORATE DEGREE
100.0/ 100
METRIC RATING
40th/ 347
METRIC RANK
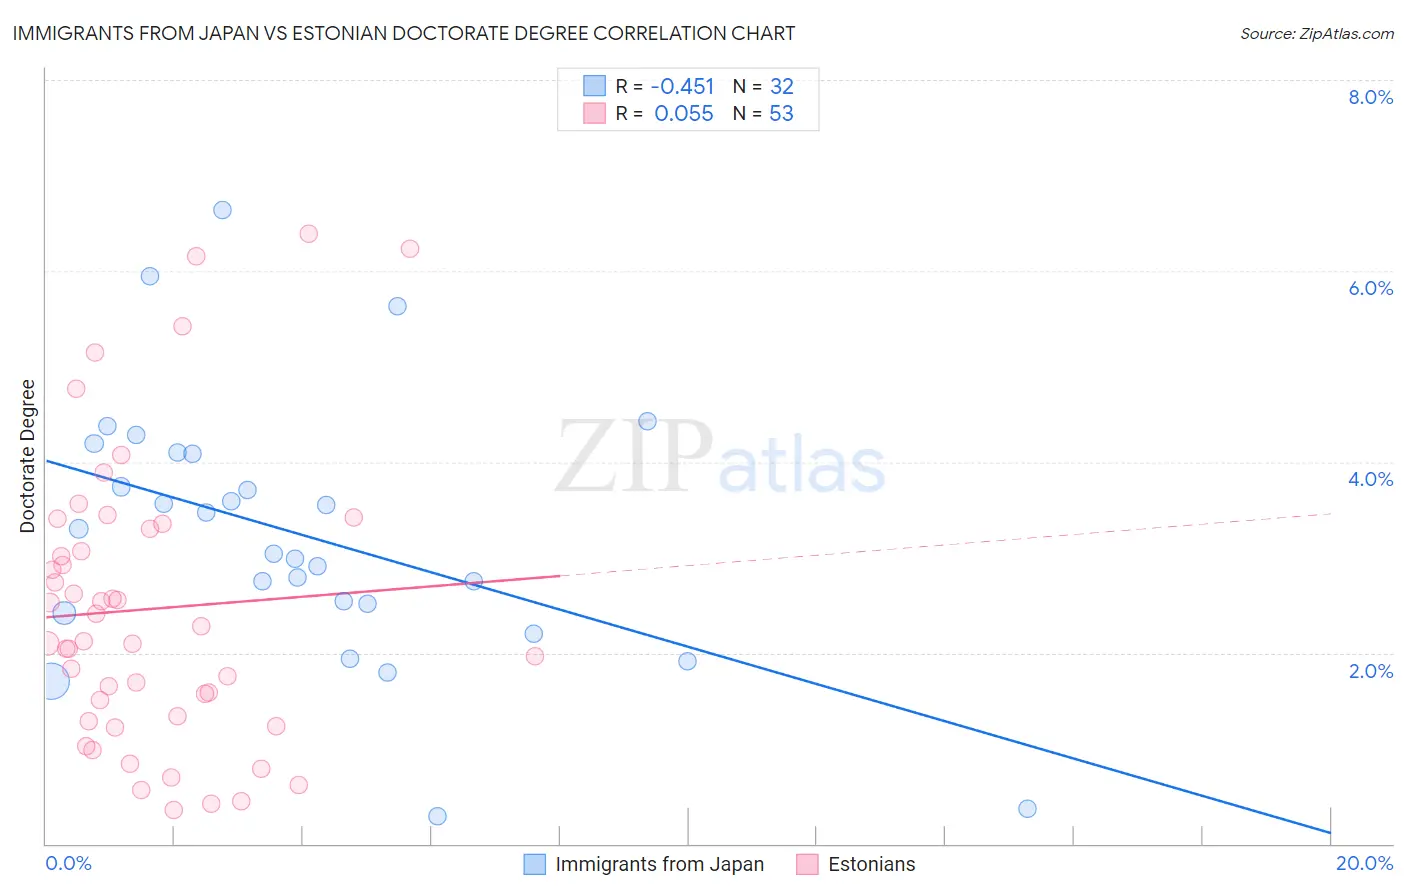
Immigrants from Japan vs Estonian Doctorate Degree Correlation Chart
The statistical analysis conducted on geographies consisting of 338,241,347 people shows a moderate negative correlation between the proportion of Immigrants from Japan and percentage of population with at least doctorate degree education in the United States with a correlation coefficient (R) of -0.451 and weighted average of 2.8%. Similarly, the statistical analysis conducted on geographies consisting of 123,266,987 people shows a slight positive correlation between the proportion of Estonians and percentage of population with at least doctorate degree education in the United States with a correlation coefficient (R) of 0.055 and weighted average of 2.5%, a difference of 10.1%.
Doctorate Degree Correlation Summary
| Measurement | Immigrants from Japan | Estonian |
| Minimum | 0.28% | 0.36% |
| Maximum | 6.6% | 6.4% |
| Range | 6.4% | 6.0% |
| Mean | 3.2% | 2.5% |
| Median | 3.2% | 2.1% |
| Interquartile 25% (IQ1) | 2.5% | 1.3% |
| Interquartile 75% (IQ3) | 4.1% | 3.3% |
| Interquartile Range (IQR) | 1.6% | 2.0% |
| Standard Deviation (Sample) | 1.4% | 1.5% |
| Standard Deviation (Population) | 1.4% | 1.5% |
Similar Demographics by Doctorate Degree
Demographics Similar to Immigrants from Japan by Doctorate Degree
In terms of doctorate degree, the demographic groups most similar to Immigrants from Japan are Immigrants from Hong Kong (2.8%, a difference of 0.35%), Immigrants from Sri Lanka (2.8%, a difference of 0.37%), Immigrants from Australia (2.8%, a difference of 0.62%), Thai (2.8%, a difference of 0.70%), and Mongolian (2.8%, a difference of 0.91%).
| Demographics | Rating | Rank | Doctorate Degree |
| Immigrants | Belgium | 100.0 /100 | #12 | Exceptional 2.9% |
| Immigrants | Sweden | 100.0 /100 | #13 | Exceptional 2.9% |
| Immigrants | France | 100.0 /100 | #14 | Exceptional 2.9% |
| Immigrants | India | 100.0 /100 | #15 | Exceptional 2.8% |
| Eastern Europeans | 100.0 /100 | #16 | Exceptional 2.8% |
| Immigrants | Australia | 100.0 /100 | #17 | Exceptional 2.8% |
| Immigrants | Sri Lanka | 100.0 /100 | #18 | Exceptional 2.8% |
| Immigrants | Japan | 100.0 /100 | #19 | Exceptional 2.8% |
| Immigrants | Hong Kong | 100.0 /100 | #20 | Exceptional 2.8% |
| Thais | 100.0 /100 | #21 | Exceptional 2.8% |
| Mongolians | 100.0 /100 | #22 | Exceptional 2.8% |
| Immigrants | Denmark | 100.0 /100 | #23 | Exceptional 2.8% |
| Israelis | 100.0 /100 | #24 | Exceptional 2.7% |
| Immigrants | Saudi Arabia | 100.0 /100 | #25 | Exceptional 2.7% |
| Turks | 100.0 /100 | #26 | Exceptional 2.7% |
Demographics Similar to Estonians by Doctorate Degree
In terms of doctorate degree, the demographic groups most similar to Estonians are Immigrants from Russia (2.5%, a difference of 0.33%), Immigrants from Ireland (2.5%, a difference of 0.41%), Russian (2.6%, a difference of 0.91%), New Zealander (2.5%, a difference of 0.96%), and Immigrants from Kuwait (2.6%, a difference of 1.1%).
| Demographics | Rating | Rank | Doctorate Degree |
| Cambodians | 100.0 /100 | #33 | Exceptional 2.6% |
| Cypriots | 100.0 /100 | #34 | Exceptional 2.6% |
| Immigrants | Malaysia | 100.0 /100 | #35 | Exceptional 2.6% |
| Immigrants | Spain | 100.0 /100 | #36 | Exceptional 2.6% |
| Immigrants | Kuwait | 100.0 /100 | #37 | Exceptional 2.6% |
| Russians | 100.0 /100 | #38 | Exceptional 2.6% |
| Immigrants | Ireland | 100.0 /100 | #39 | Exceptional 2.5% |
| Estonians | 100.0 /100 | #40 | Exceptional 2.5% |
| Immigrants | Russia | 100.0 /100 | #41 | Exceptional 2.5% |
| New Zealanders | 100.0 /100 | #42 | Exceptional 2.5% |
| Soviet Union | 100.0 /100 | #43 | Exceptional 2.5% |
| Immigrants | Netherlands | 100.0 /100 | #44 | Exceptional 2.5% |
| Immigrants | South Africa | 100.0 /100 | #45 | Exceptional 2.4% |
| Immigrants | Austria | 100.0 /100 | #46 | Exceptional 2.4% |
| Immigrants | Western Europe | 100.0 /100 | #47 | Exceptional 2.4% |