Immigrants from Kazakhstan vs Estonian Doctorate Degree
COMPARE
Immigrants from Kazakhstan
Estonian
Doctorate Degree
Doctorate Degree Comparison
Immigrants from Kazakhstan
Estonians
2.3%
DOCTORATE DEGREE
99.8/ 100
METRIC RATING
68th/ 347
METRIC RANK
2.5%
DOCTORATE DEGREE
100.0/ 100
METRIC RATING
40th/ 347
METRIC RANK
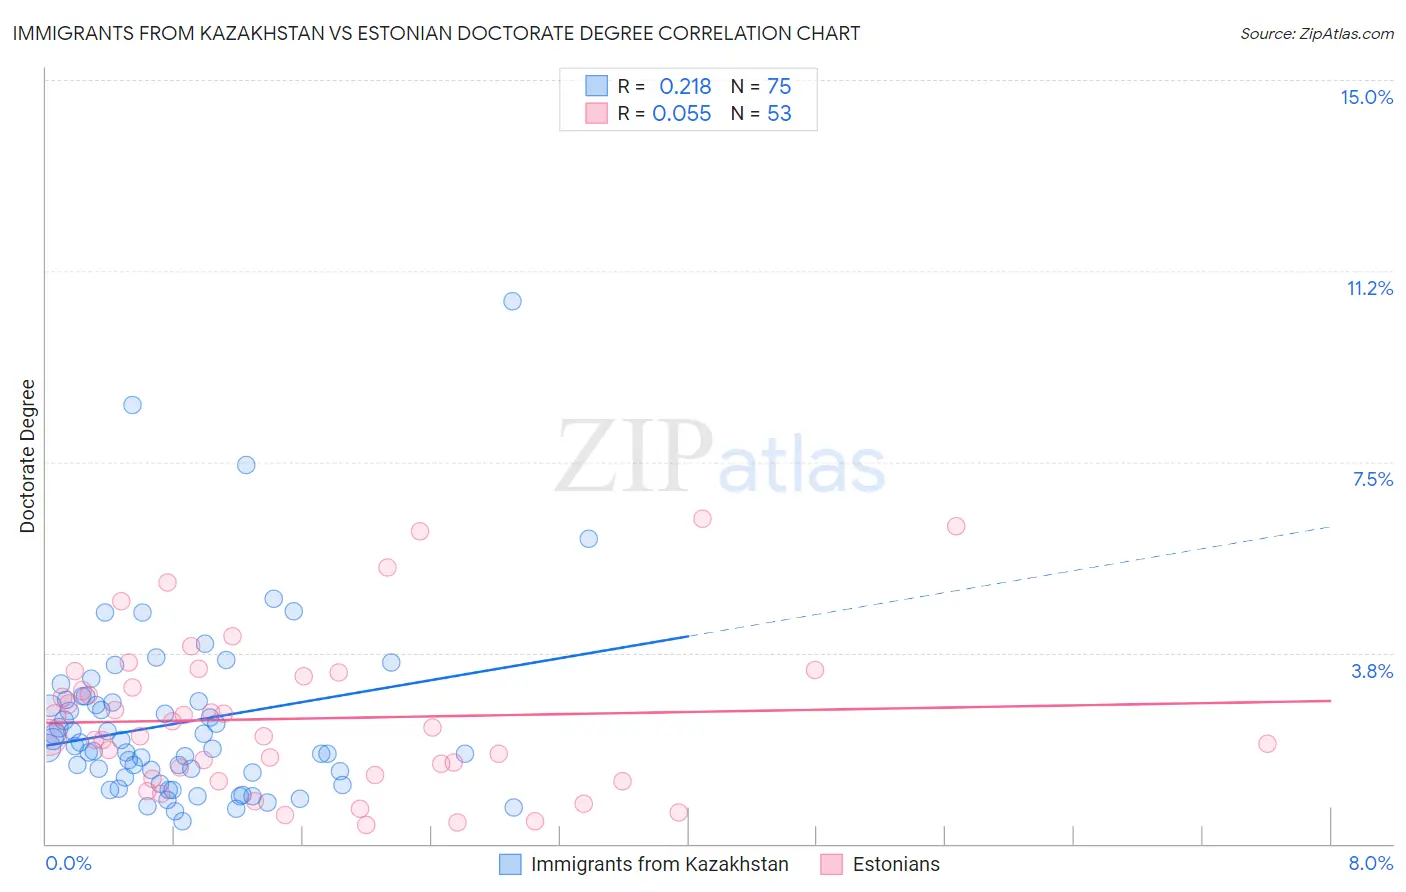
Immigrants from Kazakhstan vs Estonian Doctorate Degree Correlation Chart
The statistical analysis conducted on geographies consisting of 124,281,798 people shows a weak positive correlation between the proportion of Immigrants from Kazakhstan and percentage of population with at least doctorate degree education in the United States with a correlation coefficient (R) of 0.218 and weighted average of 2.3%. Similarly, the statistical analysis conducted on geographies consisting of 123,266,987 people shows a slight positive correlation between the proportion of Estonians and percentage of population with at least doctorate degree education in the United States with a correlation coefficient (R) of 0.055 and weighted average of 2.5%, a difference of 11.5%.
Doctorate Degree Correlation Summary
| Measurement | Immigrants from Kazakhstan | Estonian |
| Minimum | 0.44% | 0.36% |
| Maximum | 10.6% | 6.4% |
| Range | 10.2% | 6.0% |
| Mean | 2.4% | 2.5% |
| Median | 1.9% | 2.1% |
| Interquartile 25% (IQ1) | 1.3% | 1.3% |
| Interquartile 75% (IQ3) | 2.8% | 3.3% |
| Interquartile Range (IQR) | 1.5% | 2.0% |
| Standard Deviation (Sample) | 1.8% | 1.5% |
| Standard Deviation (Population) | 1.8% | 1.5% |
Similar Demographics by Doctorate Degree
Demographics Similar to Immigrants from Kazakhstan by Doctorate Degree
In terms of doctorate degree, the demographic groups most similar to Immigrants from Kazakhstan are Zimbabwean (2.3%, a difference of 0.23%), Carpatho Rusyn (2.3%, a difference of 0.25%), Lithuanian (2.3%, a difference of 0.39%), Immigrants from Bolivia (2.3%, a difference of 0.39%), and Immigrants from Canada (2.3%, a difference of 0.55%).
| Demographics | Rating | Rank | Doctorate Degree |
| Bhutanese | 99.9 /100 | #61 | Exceptional 2.3% |
| Immigrants | Europe | 99.9 /100 | #62 | Exceptional 2.3% |
| Laotians | 99.9 /100 | #63 | Exceptional 2.3% |
| Immigrants | Greece | 99.9 /100 | #64 | Exceptional 2.3% |
| Paraguayans | 99.9 /100 | #65 | Exceptional 2.3% |
| Argentineans | 99.9 /100 | #66 | Exceptional 2.3% |
| Zimbabweans | 99.8 /100 | #67 | Exceptional 2.3% |
| Immigrants | Kazakhstan | 99.8 /100 | #68 | Exceptional 2.3% |
| Carpatho Rusyns | 99.8 /100 | #69 | Exceptional 2.3% |
| Lithuanians | 99.8 /100 | #70 | Exceptional 2.3% |
| Immigrants | Bolivia | 99.8 /100 | #71 | Exceptional 2.3% |
| Immigrants | Canada | 99.8 /100 | #72 | Exceptional 2.3% |
| Immigrants | Bulgaria | 99.8 /100 | #73 | Exceptional 2.3% |
| Immigrants | North America | 99.8 /100 | #74 | Exceptional 2.2% |
| Immigrants | Western Asia | 99.8 /100 | #75 | Exceptional 2.2% |
Demographics Similar to Estonians by Doctorate Degree
In terms of doctorate degree, the demographic groups most similar to Estonians are Immigrants from Russia (2.5%, a difference of 0.33%), Immigrants from Ireland (2.5%, a difference of 0.41%), Russian (2.6%, a difference of 0.91%), New Zealander (2.5%, a difference of 0.96%), and Immigrants from Kuwait (2.6%, a difference of 1.1%).
| Demographics | Rating | Rank | Doctorate Degree |
| Cambodians | 100.0 /100 | #33 | Exceptional 2.6% |
| Cypriots | 100.0 /100 | #34 | Exceptional 2.6% |
| Immigrants | Malaysia | 100.0 /100 | #35 | Exceptional 2.6% |
| Immigrants | Spain | 100.0 /100 | #36 | Exceptional 2.6% |
| Immigrants | Kuwait | 100.0 /100 | #37 | Exceptional 2.6% |
| Russians | 100.0 /100 | #38 | Exceptional 2.6% |
| Immigrants | Ireland | 100.0 /100 | #39 | Exceptional 2.5% |
| Estonians | 100.0 /100 | #40 | Exceptional 2.5% |
| Immigrants | Russia | 100.0 /100 | #41 | Exceptional 2.5% |
| New Zealanders | 100.0 /100 | #42 | Exceptional 2.5% |
| Soviet Union | 100.0 /100 | #43 | Exceptional 2.5% |
| Immigrants | Netherlands | 100.0 /100 | #44 | Exceptional 2.5% |
| Immigrants | South Africa | 100.0 /100 | #45 | Exceptional 2.4% |
| Immigrants | Austria | 100.0 /100 | #46 | Exceptional 2.4% |
| Immigrants | Western Europe | 100.0 /100 | #47 | Exceptional 2.4% |