Immigrants from Italy vs Cape Verdean 1st Grade
COMPARE
Immigrants from Italy
Cape Verdean
1st Grade
1st Grade Comparison
Immigrants from Italy
Cape Verdeans
97.9%
1ST GRADE
59.1/ 100
METRIC RATING
161st/ 347
METRIC RANK
96.9%
1ST GRADE
0.0/ 100
METRIC RATING
312th/ 347
METRIC RANK
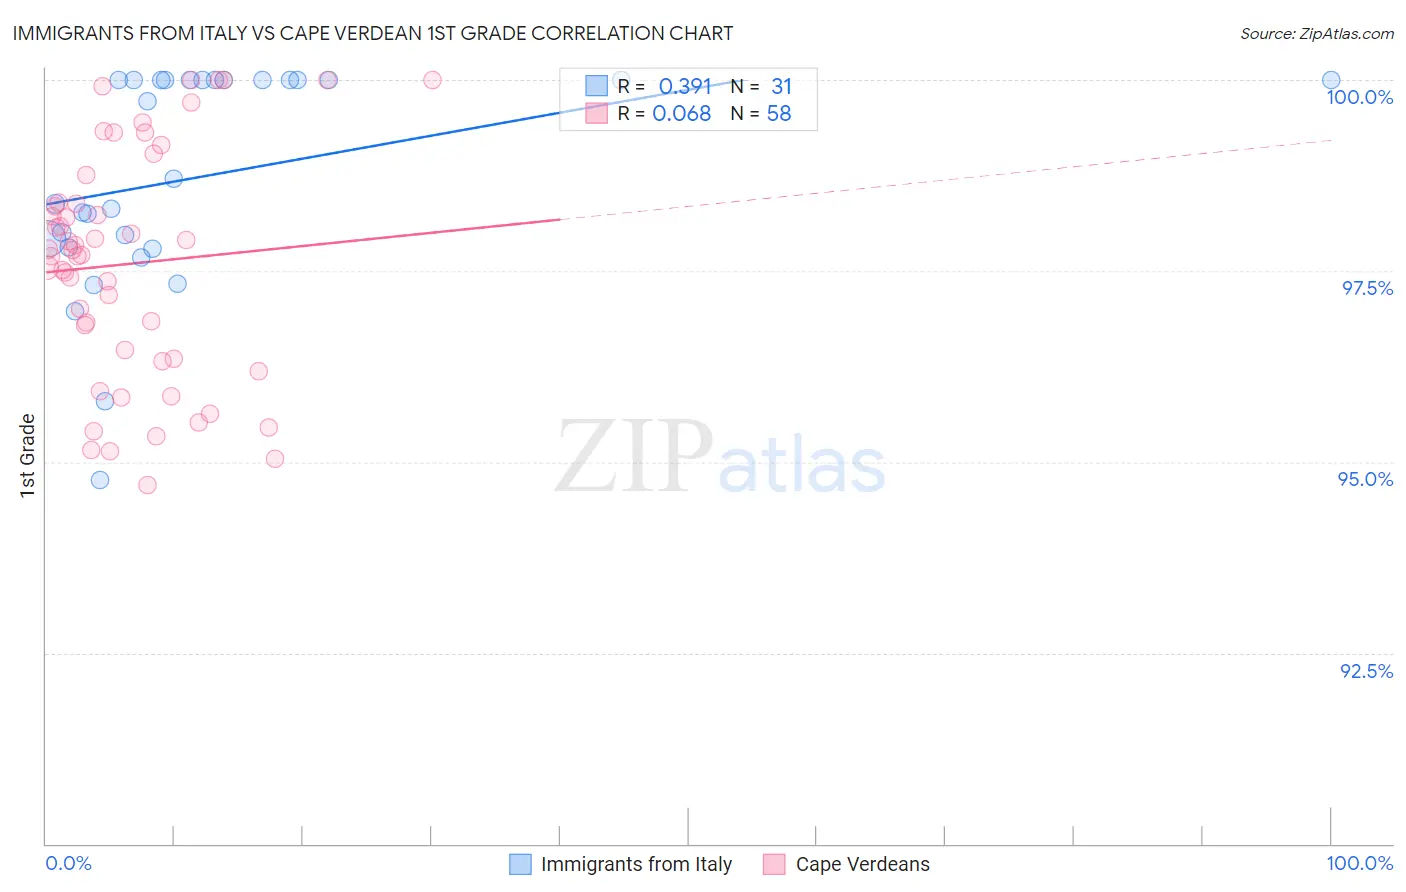
Immigrants from Italy vs Cape Verdean 1st Grade Correlation Chart
The statistical analysis conducted on geographies consisting of 324,225,917 people shows a mild positive correlation between the proportion of Immigrants from Italy and percentage of population with at least 1st grade education in the United States with a correlation coefficient (R) of 0.391 and weighted average of 97.9%. Similarly, the statistical analysis conducted on geographies consisting of 107,537,955 people shows a slight positive correlation between the proportion of Cape Verdeans and percentage of population with at least 1st grade education in the United States with a correlation coefficient (R) of 0.068 and weighted average of 96.9%, a difference of 1.1%.
1st Grade Correlation Summary
| Measurement | Immigrants from Italy | Cape Verdean |
| Minimum | 94.8% | 94.7% |
| Maximum | 100.0% | 100.0% |
| Range | 5.2% | 5.3% |
| Mean | 98.7% | 97.6% |
| Median | 98.7% | 97.7% |
| Interquartile 25% (IQ1) | 97.8% | 96.4% |
| Interquartile 75% (IQ3) | 100.0% | 98.4% |
| Interquartile Range (IQR) | 2.2% | 2.0% |
| Standard Deviation (Sample) | 1.4% | 1.5% |
| Standard Deviation (Population) | 1.4% | 1.5% |
Similar Demographics by 1st Grade
Demographics Similar to Immigrants from Italy by 1st Grade
In terms of 1st grade, the demographic groups most similar to Immigrants from Italy are Immigrants from Russia (97.9%, a difference of 0.0%), Immigrants from Eastern Europe (97.9%, a difference of 0.0%), Spanish American (97.9%, a difference of 0.0%), Brazilian (97.9%, a difference of 0.0%), and Ugandan (97.9%, a difference of 0.010%).
| Demographics | Rating | Rank | 1st Grade |
| Immigrants | Iran | 66.9 /100 | #154 | Good 98.0% |
| Comanche | 66.9 /100 | #155 | Good 98.0% |
| Immigrants | South Central Asia | 66.2 /100 | #156 | Good 98.0% |
| Immigrants | North Macedonia | 65.3 /100 | #157 | Good 98.0% |
| Venezuelans | 64.7 /100 | #158 | Good 98.0% |
| French American Indians | 63.7 /100 | #159 | Good 98.0% |
| Immigrants | Russia | 59.2 /100 | #160 | Average 97.9% |
| Immigrants | Italy | 59.1 /100 | #161 | Average 97.9% |
| Immigrants | Eastern Europe | 58.9 /100 | #162 | Average 97.9% |
| Spanish Americans | 57.7 /100 | #163 | Average 97.9% |
| Brazilians | 57.6 /100 | #164 | Average 97.9% |
| Ugandans | 56.9 /100 | #165 | Average 97.9% |
| Navajo | 56.6 /100 | #166 | Average 97.9% |
| Bermudans | 56.3 /100 | #167 | Average 97.9% |
| Chileans | 55.6 /100 | #168 | Average 97.9% |
Demographics Similar to Cape Verdeans by 1st Grade
In terms of 1st grade, the demographic groups most similar to Cape Verdeans are Sri Lankan (96.9%, a difference of 0.0%), Guyanese (96.9%, a difference of 0.010%), Honduran (96.9%, a difference of 0.020%), Hispanic or Latino (96.9%, a difference of 0.030%), and Immigrants from Haiti (96.9%, a difference of 0.030%).
| Demographics | Rating | Rank | 1st Grade |
| Ecuadorians | 0.0 /100 | #305 | Tragic 97.0% |
| Belizeans | 0.0 /100 | #306 | Tragic 96.9% |
| Immigrants | Somalia | 0.0 /100 | #307 | Tragic 96.9% |
| Hispanics or Latinos | 0.0 /100 | #308 | Tragic 96.9% |
| Immigrants | Haiti | 0.0 /100 | #309 | Tragic 96.9% |
| Immigrants | Azores | 0.0 /100 | #310 | Tragic 96.9% |
| Sri Lankans | 0.0 /100 | #311 | Tragic 96.9% |
| Cape Verdeans | 0.0 /100 | #312 | Tragic 96.9% |
| Guyanese | 0.0 /100 | #313 | Tragic 96.9% |
| Hondurans | 0.0 /100 | #314 | Tragic 96.9% |
| Immigrants | Belize | 0.0 /100 | #315 | Tragic 96.9% |
| Immigrants | Ecuador | 0.0 /100 | #316 | Tragic 96.9% |
| Immigrants | Nicaragua | 0.0 /100 | #317 | Tragic 96.9% |
| Immigrants | Laos | 0.0 /100 | #318 | Tragic 96.8% |
| Immigrants | Guyana | 0.0 /100 | #319 | Tragic 96.8% |