Immigrants from Italy vs Immigrants from Honduras 1st Grade
COMPARE
Immigrants from Italy
Immigrants from Honduras
1st Grade
1st Grade Comparison
Immigrants from Italy
Immigrants from Honduras
97.9%
1ST GRADE
59.1/ 100
METRIC RATING
161st/ 347
METRIC RANK
96.8%
1ST GRADE
0.0/ 100
METRIC RATING
323rd/ 347
METRIC RANK
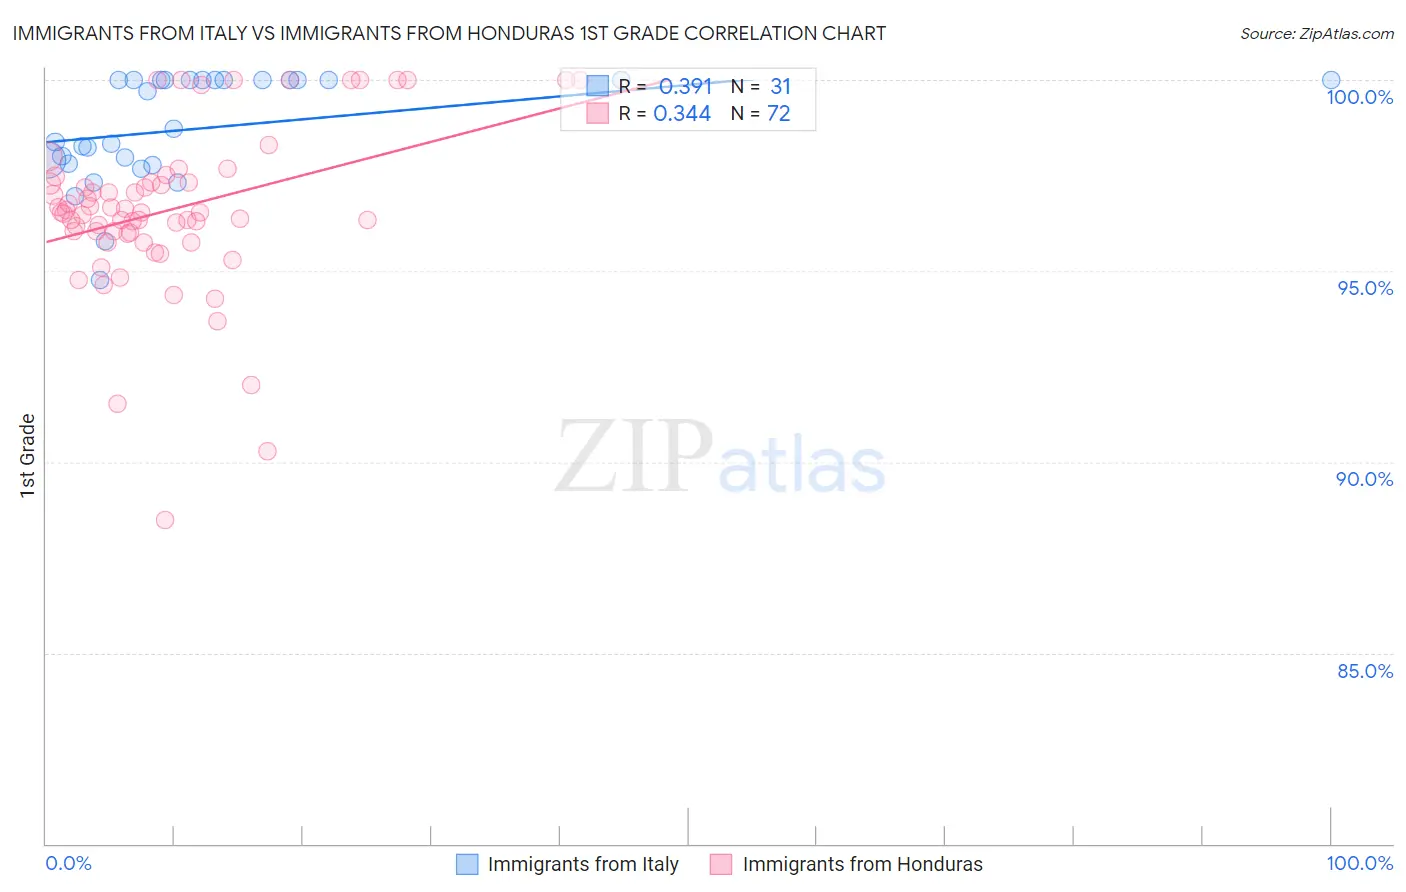
Immigrants from Italy vs Immigrants from Honduras 1st Grade Correlation Chart
The statistical analysis conducted on geographies consisting of 324,225,917 people shows a mild positive correlation between the proportion of Immigrants from Italy and percentage of population with at least 1st grade education in the United States with a correlation coefficient (R) of 0.391 and weighted average of 97.9%. Similarly, the statistical analysis conducted on geographies consisting of 322,637,445 people shows a mild positive correlation between the proportion of Immigrants from Honduras and percentage of population with at least 1st grade education in the United States with a correlation coefficient (R) of 0.344 and weighted average of 96.8%, a difference of 1.2%.
1st Grade Correlation Summary
| Measurement | Immigrants from Italy | Immigrants from Honduras |
| Minimum | 94.8% | 88.5% |
| Maximum | 100.0% | 100.0% |
| Range | 5.2% | 11.5% |
| Mean | 98.7% | 96.6% |
| Median | 98.7% | 96.5% |
| Interquartile 25% (IQ1) | 97.8% | 96.0% |
| Interquartile 75% (IQ3) | 100.0% | 97.3% |
| Interquartile Range (IQR) | 2.2% | 1.3% |
| Standard Deviation (Sample) | 1.4% | 2.2% |
| Standard Deviation (Population) | 1.4% | 2.1% |
Similar Demographics by 1st Grade
Demographics Similar to Immigrants from Italy by 1st Grade
In terms of 1st grade, the demographic groups most similar to Immigrants from Italy are Immigrants from Russia (97.9%, a difference of 0.0%), Immigrants from Eastern Europe (97.9%, a difference of 0.0%), Spanish American (97.9%, a difference of 0.0%), Brazilian (97.9%, a difference of 0.0%), and Ugandan (97.9%, a difference of 0.010%).
| Demographics | Rating | Rank | 1st Grade |
| Immigrants | Iran | 66.9 /100 | #154 | Good 98.0% |
| Comanche | 66.9 /100 | #155 | Good 98.0% |
| Immigrants | South Central Asia | 66.2 /100 | #156 | Good 98.0% |
| Immigrants | North Macedonia | 65.3 /100 | #157 | Good 98.0% |
| Venezuelans | 64.7 /100 | #158 | Good 98.0% |
| French American Indians | 63.7 /100 | #159 | Good 98.0% |
| Immigrants | Russia | 59.2 /100 | #160 | Average 97.9% |
| Immigrants | Italy | 59.1 /100 | #161 | Average 97.9% |
| Immigrants | Eastern Europe | 58.9 /100 | #162 | Average 97.9% |
| Spanish Americans | 57.7 /100 | #163 | Average 97.9% |
| Brazilians | 57.6 /100 | #164 | Average 97.9% |
| Ugandans | 56.9 /100 | #165 | Average 97.9% |
| Navajo | 56.6 /100 | #166 | Average 97.9% |
| Bermudans | 56.3 /100 | #167 | Average 97.9% |
| Chileans | 55.6 /100 | #168 | Average 97.9% |
Demographics Similar to Immigrants from Honduras by 1st Grade
In terms of 1st grade, the demographic groups most similar to Immigrants from Honduras are Mexican American Indian (96.8%, a difference of 0.010%), Vietnamese (96.8%, a difference of 0.010%), Immigrants from Bangladesh (96.8%, a difference of 0.020%), Immigrants from Guyana (96.8%, a difference of 0.030%), and Immigrants from Burma/Myanmar (96.8%, a difference of 0.030%).
| Demographics | Rating | Rank | 1st Grade |
| Immigrants | Ecuador | 0.0 /100 | #316 | Tragic 96.9% |
| Immigrants | Nicaragua | 0.0 /100 | #317 | Tragic 96.9% |
| Immigrants | Laos | 0.0 /100 | #318 | Tragic 96.8% |
| Immigrants | Guyana | 0.0 /100 | #319 | Tragic 96.8% |
| Immigrants | Burma/Myanmar | 0.0 /100 | #320 | Tragic 96.8% |
| Immigrants | Bangladesh | 0.0 /100 | #321 | Tragic 96.8% |
| Mexican American Indians | 0.0 /100 | #322 | Tragic 96.8% |
| Immigrants | Honduras | 0.0 /100 | #323 | Tragic 96.8% |
| Vietnamese | 0.0 /100 | #324 | Tragic 96.8% |
| Dominicans | 0.0 /100 | #325 | Tragic 96.7% |
| Indonesians | 0.0 /100 | #326 | Tragic 96.7% |
| Mexicans | 0.0 /100 | #327 | Tragic 96.7% |
| Immigrants | Latin America | 0.0 /100 | #328 | Tragic 96.7% |
| Japanese | 0.0 /100 | #329 | Tragic 96.6% |
| Immigrants | Vietnam | 0.0 /100 | #330 | Tragic 96.6% |