Immigrants from Israel vs Cheyenne 10th Grade
COMPARE
Immigrants from Israel
Cheyenne
10th Grade
10th Grade Comparison
Immigrants from Israel
Cheyenne
94.4%
10TH GRADE
95.4/ 100
METRIC RATING
119th/ 347
METRIC RANK
93.5%
10TH GRADE
26.8/ 100
METRIC RATING
195th/ 347
METRIC RANK
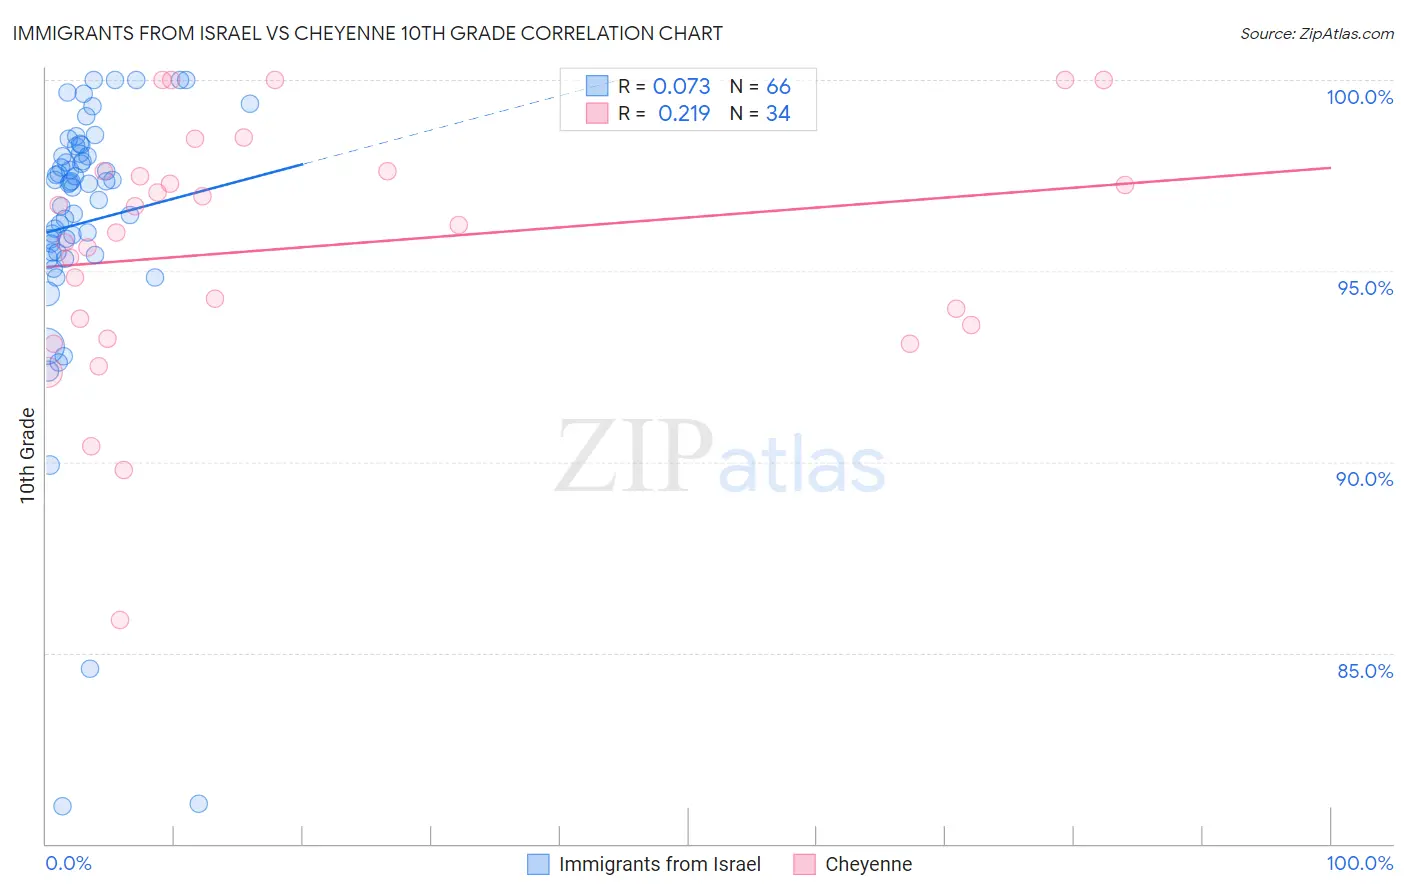
Immigrants from Israel vs Cheyenne 10th Grade Correlation Chart
The statistical analysis conducted on geographies consisting of 210,030,386 people shows a slight positive correlation between the proportion of Immigrants from Israel and percentage of population with at least 10th grade education in the United States with a correlation coefficient (R) of 0.073 and weighted average of 94.4%. Similarly, the statistical analysis conducted on geographies consisting of 80,719,411 people shows a weak positive correlation between the proportion of Cheyenne and percentage of population with at least 10th grade education in the United States with a correlation coefficient (R) of 0.219 and weighted average of 93.5%, a difference of 0.91%.
10th Grade Correlation Summary
| Measurement | Immigrants from Israel | Cheyenne |
| Minimum | 81.0% | 85.8% |
| Maximum | 100.0% | 100.0% |
| Range | 19.0% | 14.2% |
| Mean | 96.3% | 95.6% |
| Median | 97.3% | 96.1% |
| Interquartile 25% (IQ1) | 95.5% | 93.6% |
| Interquartile 75% (IQ3) | 98.1% | 97.6% |
| Interquartile Range (IQR) | 2.6% | 4.0% |
| Standard Deviation (Sample) | 3.7% | 3.2% |
| Standard Deviation (Population) | 3.7% | 3.2% |
Similar Demographics by 10th Grade
Demographics Similar to Immigrants from Israel by 10th Grade
In terms of 10th grade, the demographic groups most similar to Immigrants from Israel are Jordanian (94.4%, a difference of 0.010%), Immigrants from Taiwan (94.4%, a difference of 0.010%), Immigrants from Belarus (94.4%, a difference of 0.010%), Inupiat (94.4%, a difference of 0.010%), and Immigrants from Hungary (94.4%, a difference of 0.020%).
| Demographics | Rating | Rank | 10th Grade |
| Immigrants | Kuwait | 96.8 /100 | #112 | Exceptional 94.4% |
| Palestinians | 96.5 /100 | #113 | Exceptional 94.4% |
| German Russians | 96.3 /100 | #114 | Exceptional 94.4% |
| Delaware | 96.3 /100 | #115 | Exceptional 94.4% |
| Sioux | 96.2 /100 | #116 | Exceptional 94.4% |
| Immigrants | Hungary | 95.8 /100 | #117 | Exceptional 94.4% |
| Jordanians | 95.6 /100 | #118 | Exceptional 94.4% |
| Immigrants | Israel | 95.4 /100 | #119 | Exceptional 94.4% |
| Immigrants | Taiwan | 95.3 /100 | #120 | Exceptional 94.4% |
| Immigrants | Belarus | 95.2 /100 | #121 | Exceptional 94.4% |
| Inupiat | 95.1 /100 | #122 | Exceptional 94.4% |
| Cree | 95.1 /100 | #123 | Exceptional 94.4% |
| Basques | 94.9 /100 | #124 | Exceptional 94.3% |
| Americans | 94.4 /100 | #125 | Exceptional 94.3% |
| Immigrants | Iran | 94.4 /100 | #126 | Exceptional 94.3% |
Demographics Similar to Cheyenne by 10th Grade
In terms of 10th grade, the demographic groups most similar to Cheyenne are Immigrants from Morocco (93.5%, a difference of 0.0%), Immigrants from Malaysia (93.5%, a difference of 0.010%), Panamanian (93.5%, a difference of 0.010%), Moroccan (93.5%, a difference of 0.020%), and Pueblo (93.5%, a difference of 0.030%).
| Demographics | Rating | Rank | 10th Grade |
| Marshallese | 33.2 /100 | #188 | Fair 93.6% |
| Immigrants | Pakistan | 32.5 /100 | #189 | Fair 93.6% |
| Laotians | 32.1 /100 | #190 | Fair 93.6% |
| Yup'ik | 31.1 /100 | #191 | Fair 93.6% |
| Immigrants | Malaysia | 28.0 /100 | #192 | Fair 93.5% |
| Panamanians | 28.0 /100 | #193 | Fair 93.5% |
| Immigrants | Morocco | 26.9 /100 | #194 | Fair 93.5% |
| Cheyenne | 26.8 /100 | #195 | Fair 93.5% |
| Moroccans | 25.3 /100 | #196 | Fair 93.5% |
| Pueblo | 23.9 /100 | #197 | Fair 93.5% |
| Immigrants | Micronesia | 23.2 /100 | #198 | Fair 93.5% |
| Asians | 23.0 /100 | #199 | Fair 93.5% |
| Hopi | 22.2 /100 | #200 | Fair 93.5% |
| Hawaiians | 21.8 /100 | #201 | Fair 93.5% |
| Immigrants | Uganda | 20.9 /100 | #202 | Fair 93.5% |