Immigrants from Uganda vs Cheyenne 10th Grade
COMPARE
Immigrants from Uganda
Cheyenne
10th Grade
10th Grade Comparison
Immigrants from Uganda
Cheyenne
93.5%
10TH GRADE
20.9/ 100
METRIC RATING
202nd/ 347
METRIC RANK
93.5%
10TH GRADE
26.8/ 100
METRIC RATING
195th/ 347
METRIC RANK
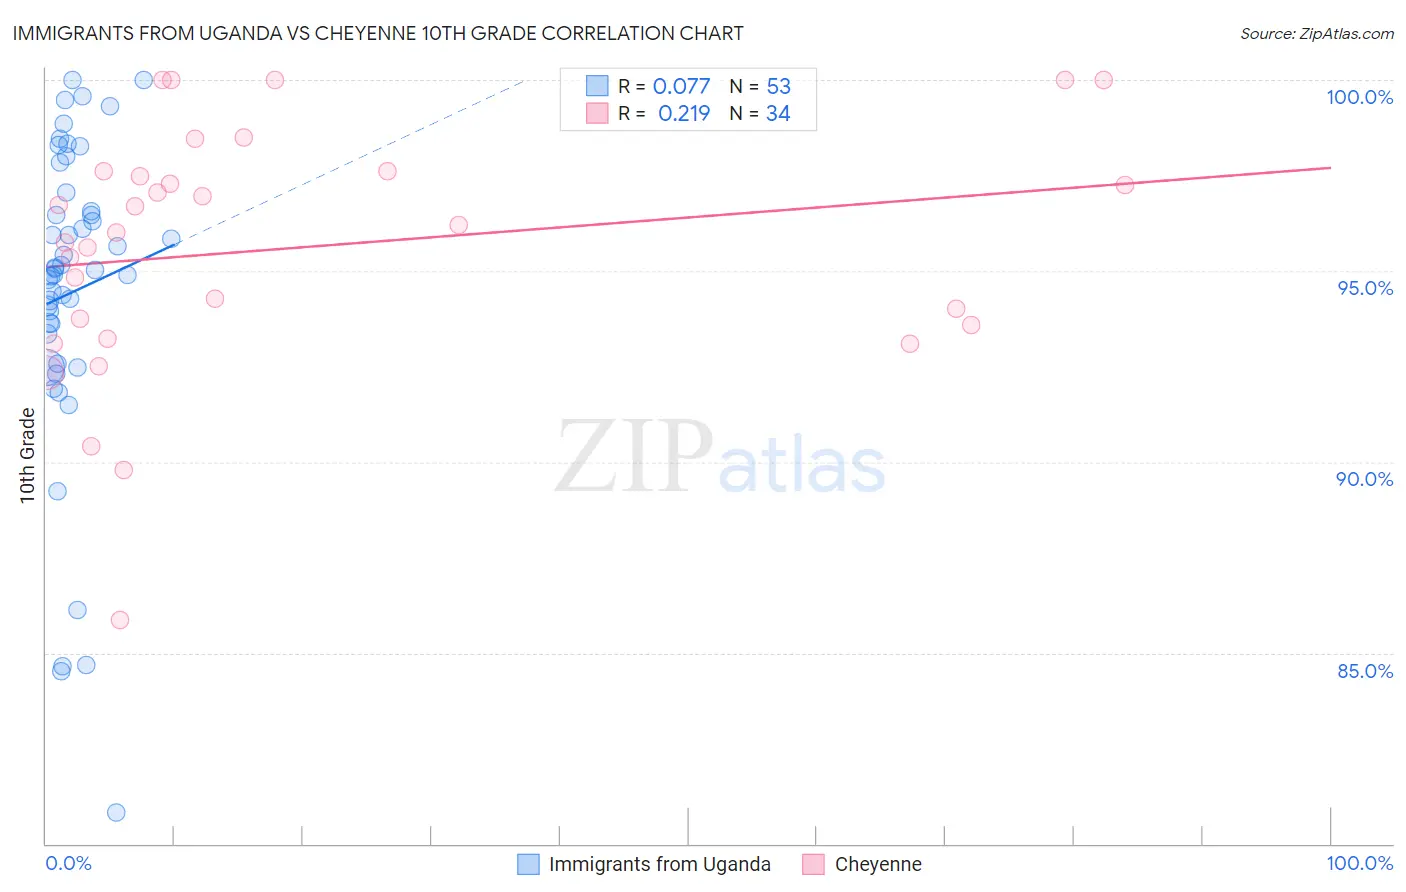
Immigrants from Uganda vs Cheyenne 10th Grade Correlation Chart
The statistical analysis conducted on geographies consisting of 125,970,180 people shows a slight positive correlation between the proportion of Immigrants from Uganda and percentage of population with at least 10th grade education in the United States with a correlation coefficient (R) of 0.077 and weighted average of 93.5%. Similarly, the statistical analysis conducted on geographies consisting of 80,719,411 people shows a weak positive correlation between the proportion of Cheyenne and percentage of population with at least 10th grade education in the United States with a correlation coefficient (R) of 0.219 and weighted average of 93.5%, a difference of 0.070%.
10th Grade Correlation Summary
| Measurement | Immigrants from Uganda | Cheyenne |
| Minimum | 80.8% | 85.8% |
| Maximum | 100.0% | 100.0% |
| Range | 19.2% | 14.2% |
| Mean | 94.4% | 95.6% |
| Median | 95.0% | 96.1% |
| Interquartile 25% (IQ1) | 93.0% | 93.6% |
| Interquartile 75% (IQ3) | 96.8% | 97.6% |
| Interquartile Range (IQR) | 3.8% | 4.0% |
| Standard Deviation (Sample) | 4.1% | 3.2% |
| Standard Deviation (Population) | 4.1% | 3.2% |
Demographics Similar to Immigrants from Uganda and Cheyenne by 10th Grade
In terms of 10th grade, the demographic groups most similar to Immigrants from Uganda are Hawaiian (93.5%, a difference of 0.010%), Immigrants from Western Asia (93.4%, a difference of 0.010%), Ute (93.4%, a difference of 0.010%), Immigrants from Indonesia (93.4%, a difference of 0.010%), and Immigrants from Sudan (93.4%, a difference of 0.010%). Similarly, the demographic groups most similar to Cheyenne are Immigrants from Morocco (93.5%, a difference of 0.0%), Immigrants from Malaysia (93.5%, a difference of 0.010%), Panamanian (93.5%, a difference of 0.010%), Moroccan (93.5%, a difference of 0.020%), and Pueblo (93.5%, a difference of 0.030%).
| Demographics | Rating | Rank | 10th Grade |
| Marshallese | 33.2 /100 | #188 | Fair 93.6% |
| Immigrants | Pakistan | 32.5 /100 | #189 | Fair 93.6% |
| Laotians | 32.1 /100 | #190 | Fair 93.6% |
| Yup'ik | 31.1 /100 | #191 | Fair 93.6% |
| Immigrants | Malaysia | 28.0 /100 | #192 | Fair 93.5% |
| Panamanians | 28.0 /100 | #193 | Fair 93.5% |
| Immigrants | Morocco | 26.9 /100 | #194 | Fair 93.5% |
| Cheyenne | 26.8 /100 | #195 | Fair 93.5% |
| Moroccans | 25.3 /100 | #196 | Fair 93.5% |
| Pueblo | 23.9 /100 | #197 | Fair 93.5% |
| Immigrants | Micronesia | 23.2 /100 | #198 | Fair 93.5% |
| Asians | 23.0 /100 | #199 | Fair 93.5% |
| Hopi | 22.2 /100 | #200 | Fair 93.5% |
| Hawaiians | 21.8 /100 | #201 | Fair 93.5% |
| Immigrants | Uganda | 20.9 /100 | #202 | Fair 93.5% |
| Immigrants | Western Asia | 20.6 /100 | #203 | Fair 93.4% |
| Ute | 20.3 /100 | #204 | Fair 93.4% |
| Immigrants | Indonesia | 20.2 /100 | #205 | Fair 93.4% |
| Immigrants | Sudan | 20.0 /100 | #206 | Fair 93.4% |
| Samoans | 19.5 /100 | #207 | Poor 93.4% |
| Immigrants | Syria | 19.4 /100 | #208 | Poor 93.4% |