Cajun vs Immigrants from Sri Lanka 11th Grade
COMPARE
Cajun
Immigrants from Sri Lanka
11th Grade
11th Grade Comparison
Cajuns
Immigrants from Sri Lanka
91.4%
11TH GRADE
0.7/ 100
METRIC RATING
257th/ 347
METRIC RANK
93.2%
11TH GRADE
95.6/ 100
METRIC RATING
125th/ 347
METRIC RANK
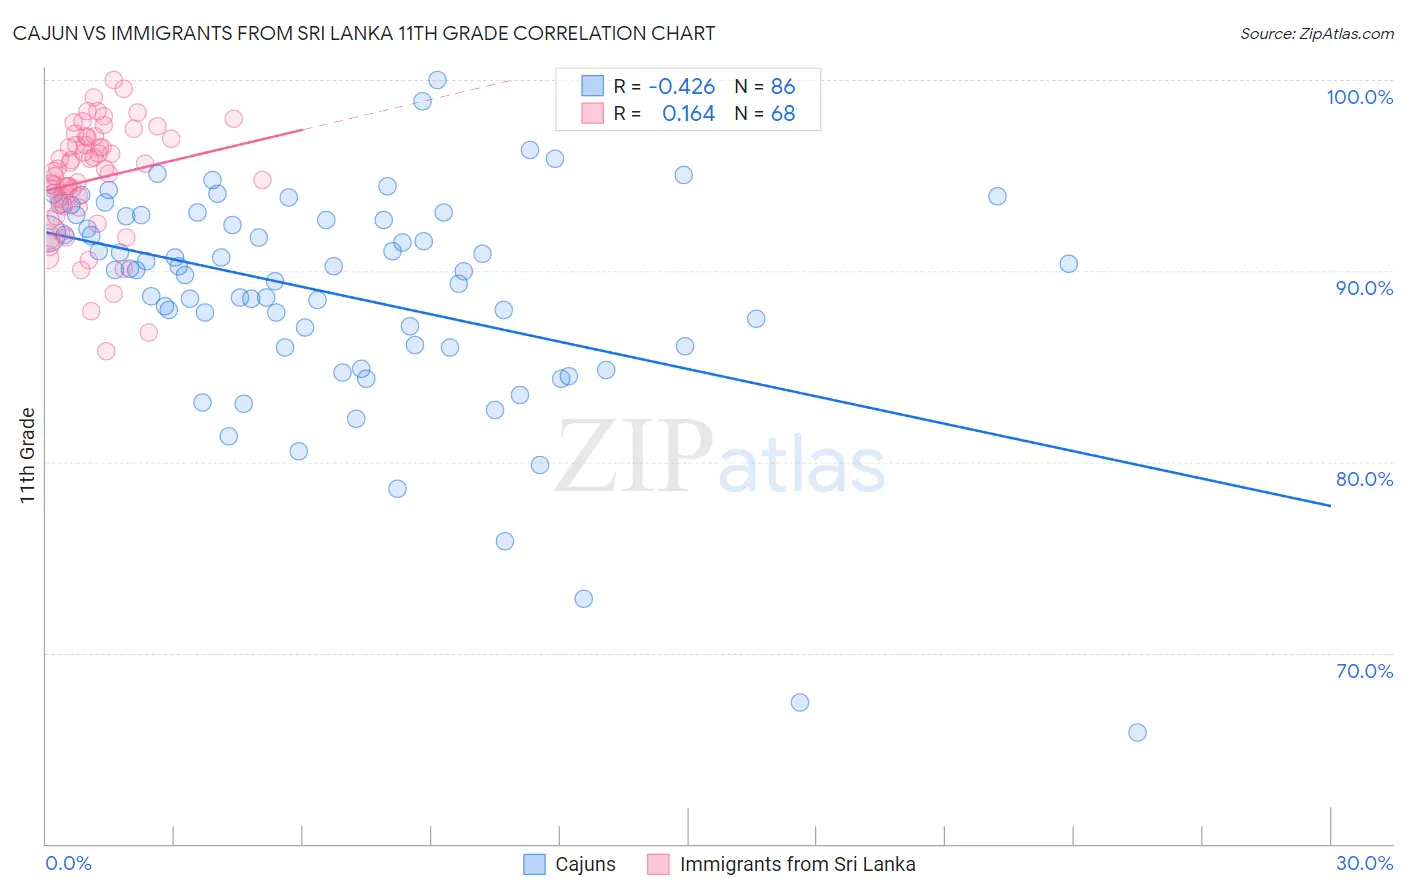
Cajun vs Immigrants from Sri Lanka 11th Grade Correlation Chart
The statistical analysis conducted on geographies consisting of 149,713,149 people shows a moderate negative correlation between the proportion of Cajuns and percentage of population with at least 11th grade education in the United States with a correlation coefficient (R) of -0.426 and weighted average of 91.4%. Similarly, the statistical analysis conducted on geographies consisting of 149,660,761 people shows a poor positive correlation between the proportion of Immigrants from Sri Lanka and percentage of population with at least 11th grade education in the United States with a correlation coefficient (R) of 0.164 and weighted average of 93.2%, a difference of 2.0%.
11th Grade Correlation Summary
| Measurement | Cajun | Immigrants from Sri Lanka |
| Minimum | 65.8% | 85.8% |
| Maximum | 100.0% | 100.0% |
| Range | 34.2% | 14.2% |
| Mean | 88.8% | 94.8% |
| Median | 90.1% | 95.3% |
| Interquartile 25% (IQ1) | 86.0% | 93.4% |
| Interquartile 75% (IQ3) | 92.9% | 97.0% |
| Interquartile Range (IQR) | 6.8% | 3.6% |
| Standard Deviation (Sample) | 5.9% | 3.0% |
| Standard Deviation (Population) | 5.9% | 3.0% |
Similar Demographics by 11th Grade
Demographics Similar to Cajuns by 11th Grade
In terms of 11th grade, the demographic groups most similar to Cajuns are Black/African American (91.4%, a difference of 0.010%), Immigrants from Senegal (91.4%, a difference of 0.010%), Immigrants from Eritrea (91.4%, a difference of 0.020%), Immigrants from Colombia (91.4%, a difference of 0.020%), and Jamaican (91.4%, a difference of 0.030%).
| Demographics | Rating | Rank | 11th Grade |
| Ghanaians | 0.9 /100 | #250 | Tragic 91.5% |
| Immigrants | Costa Rica | 0.9 /100 | #251 | Tragic 91.4% |
| Immigrants | Nigeria | 0.8 /100 | #252 | Tragic 91.4% |
| Immigrants | South America | 0.8 /100 | #253 | Tragic 91.4% |
| Immigrants | Eritrea | 0.7 /100 | #254 | Tragic 91.4% |
| Blacks/African Americans | 0.7 /100 | #255 | Tragic 91.4% |
| Immigrants | Senegal | 0.7 /100 | #256 | Tragic 91.4% |
| Cajuns | 0.7 /100 | #257 | Tragic 91.4% |
| Immigrants | Colombia | 0.6 /100 | #258 | Tragic 91.4% |
| Jamaicans | 0.6 /100 | #259 | Tragic 91.4% |
| Spanish Americans | 0.6 /100 | #260 | Tragic 91.4% |
| Taiwanese | 0.6 /100 | #261 | Tragic 91.3% |
| Immigrants | Uruguay | 0.5 /100 | #262 | Tragic 91.3% |
| Immigrants | Ghana | 0.3 /100 | #263 | Tragic 91.2% |
| Yup'ik | 0.3 /100 | #264 | Tragic 91.2% |
Demographics Similar to Immigrants from Sri Lanka by 11th Grade
In terms of 11th grade, the demographic groups most similar to Immigrants from Sri Lanka are Immigrants from Greece (93.2%, a difference of 0.020%), Immigrants from Eastern Europe (93.2%, a difference of 0.020%), Basque (93.2%, a difference of 0.020%), Immigrants from Belarus (93.3%, a difference of 0.040%), and German Russian (93.3%, a difference of 0.050%).
| Demographics | Rating | Rank | 11th Grade |
| Immigrants | Korea | 97.0 /100 | #118 | Exceptional 93.3% |
| Israelis | 97.0 /100 | #119 | Exceptional 93.3% |
| Immigrants | Russia | 96.6 /100 | #120 | Exceptional 93.3% |
| German Russians | 96.4 /100 | #121 | Exceptional 93.3% |
| Immigrants | Belarus | 96.3 /100 | #122 | Exceptional 93.3% |
| Immigrants | Greece | 95.9 /100 | #123 | Exceptional 93.2% |
| Immigrants | Eastern Europe | 95.9 /100 | #124 | Exceptional 93.2% |
| Immigrants | Sri Lanka | 95.6 /100 | #125 | Exceptional 93.2% |
| Basques | 95.2 /100 | #126 | Exceptional 93.2% |
| Immigrants | Kazakhstan | 92.4 /100 | #127 | Exceptional 93.1% |
| Immigrants | Jordan | 92.4 /100 | #128 | Exceptional 93.1% |
| Immigrants | Ukraine | 89.8 /100 | #129 | Excellent 93.0% |
| Albanians | 89.5 /100 | #130 | Excellent 93.0% |
| Egyptians | 89.5 /100 | #131 | Excellent 93.0% |
| Immigrants | Bosnia and Herzegovina | 89.0 /100 | #132 | Excellent 93.0% |