Immigrants from Iran vs Immigrants from Japan 5th Grade
COMPARE
Immigrants from Iran
Immigrants from Japan
5th Grade
5th Grade Comparison
Immigrants from Iran
Immigrants from Japan
97.4%
5TH GRADE
59.5/ 100
METRIC RATING
162nd/ 347
METRIC RANK
97.6%
5TH GRADE
94.7/ 100
METRIC RATING
122nd/ 347
METRIC RANK
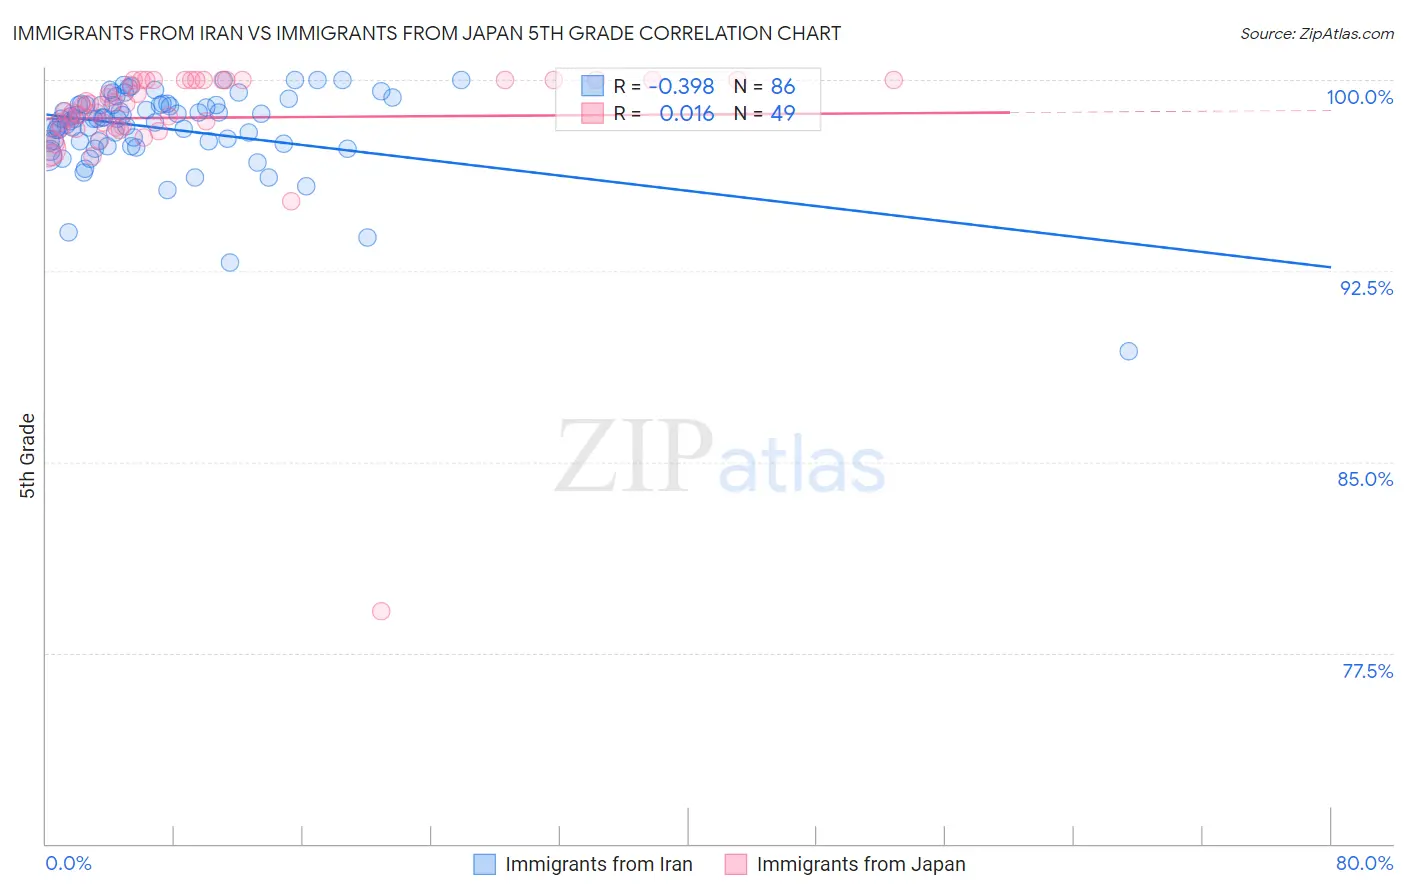
Immigrants from Iran vs Immigrants from Japan 5th Grade Correlation Chart
The statistical analysis conducted on geographies consisting of 279,867,553 people shows a mild negative correlation between the proportion of Immigrants from Iran and percentage of population with at least 5th grade education in the United States with a correlation coefficient (R) of -0.398 and weighted average of 97.4%. Similarly, the statistical analysis conducted on geographies consisting of 340,148,942 people shows no correlation between the proportion of Immigrants from Japan and percentage of population with at least 5th grade education in the United States with a correlation coefficient (R) of 0.016 and weighted average of 97.6%, a difference of 0.26%.
5th Grade Correlation Summary
| Measurement | Immigrants from Iran | Immigrants from Japan |
| Minimum | 89.4% | 79.1% |
| Maximum | 100.0% | 100.0% |
| Range | 10.6% | 20.9% |
| Mean | 98.1% | 98.5% |
| Median | 98.5% | 99.0% |
| Interquartile 25% (IQ1) | 97.6% | 98.2% |
| Interquartile 75% (IQ3) | 99.0% | 100.0% |
| Interquartile Range (IQR) | 1.5% | 1.8% |
| Standard Deviation (Sample) | 1.7% | 3.0% |
| Standard Deviation (Population) | 1.6% | 3.0% |
Similar Demographics by 5th Grade
Demographics Similar to Immigrants from Iran by 5th Grade
In terms of 5th grade, the demographic groups most similar to Immigrants from Iran are Kenyan (97.4%, a difference of 0.0%), Ugandan (97.4%, a difference of 0.0%), Bermudan (97.4%, a difference of 0.0%), Marshallese (97.4%, a difference of 0.010%), and Immigrants from Poland (97.4%, a difference of 0.010%).
| Demographics | Rating | Rank | 5th Grade |
| Immigrants | Bosnia and Herzegovina | 71.0 /100 | #155 | Good 97.4% |
| French American Indians | 70.5 /100 | #156 | Good 97.4% |
| Immigrants | Jordan | 70.4 /100 | #157 | Good 97.4% |
| Albanians | 68.3 /100 | #158 | Good 97.4% |
| Immigrants | Italy | 65.2 /100 | #159 | Good 97.4% |
| Marshallese | 61.2 /100 | #160 | Good 97.4% |
| Kenyans | 59.7 /100 | #161 | Average 97.4% |
| Immigrants | Iran | 59.5 /100 | #162 | Average 97.4% |
| Ugandans | 58.9 /100 | #163 | Average 97.4% |
| Bermudans | 58.8 /100 | #164 | Average 97.4% |
| Immigrants | Poland | 57.9 /100 | #165 | Average 97.4% |
| Apache | 57.2 /100 | #166 | Average 97.4% |
| Immigrants | Belarus | 54.6 /100 | #167 | Average 97.3% |
| Chileans | 54.5 /100 | #168 | Average 97.3% |
| Immigrants | Korea | 54.1 /100 | #169 | Average 97.3% |
Demographics Similar to Immigrants from Japan by 5th Grade
In terms of 5th grade, the demographic groups most similar to Immigrants from Japan are Immigrants from Zimbabwe (97.6%, a difference of 0.0%), Immigrants from France (97.6%, a difference of 0.0%), Immigrants from Norway (97.6%, a difference of 0.0%), Basque (97.6%, a difference of 0.010%), and Syrian (97.6%, a difference of 0.010%).
| Demographics | Rating | Rank | 5th Grade |
| Okinawans | 95.7 /100 | #115 | Exceptional 97.6% |
| Immigrants | Croatia | 95.5 /100 | #116 | Exceptional 97.6% |
| Immigrants | Saudi Arabia | 95.4 /100 | #117 | Exceptional 97.6% |
| Basques | 95.2 /100 | #118 | Exceptional 97.6% |
| Syrians | 95.1 /100 | #119 | Exceptional 97.6% |
| Immigrants | Zimbabwe | 94.9 /100 | #120 | Exceptional 97.6% |
| Immigrants | France | 94.8 /100 | #121 | Exceptional 97.6% |
| Immigrants | Japan | 94.7 /100 | #122 | Exceptional 97.6% |
| Immigrants | Norway | 94.6 /100 | #123 | Exceptional 97.6% |
| Spanish | 93.7 /100 | #124 | Exceptional 97.6% |
| Immigrants | Bulgaria | 93.1 /100 | #125 | Exceptional 97.6% |
| Hmong | 92.3 /100 | #126 | Exceptional 97.6% |
| Immigrants | Serbia | 92.3 /100 | #127 | Exceptional 97.6% |
| Colville | 92.0 /100 | #128 | Exceptional 97.6% |
| Immigrants | Europe | 91.9 /100 | #129 | Exceptional 97.6% |