Immigrants from India vs Senegalese 9th Grade
COMPARE
Immigrants from India
Senegalese
9th Grade
9th Grade Comparison
Immigrants from India
Senegalese
96.1%
9TH GRADE
99.9/ 100
METRIC RATING
46th/ 347
METRIC RANK
94.2%
9TH GRADE
1.9/ 100
METRIC RATING
246th/ 347
METRIC RANK
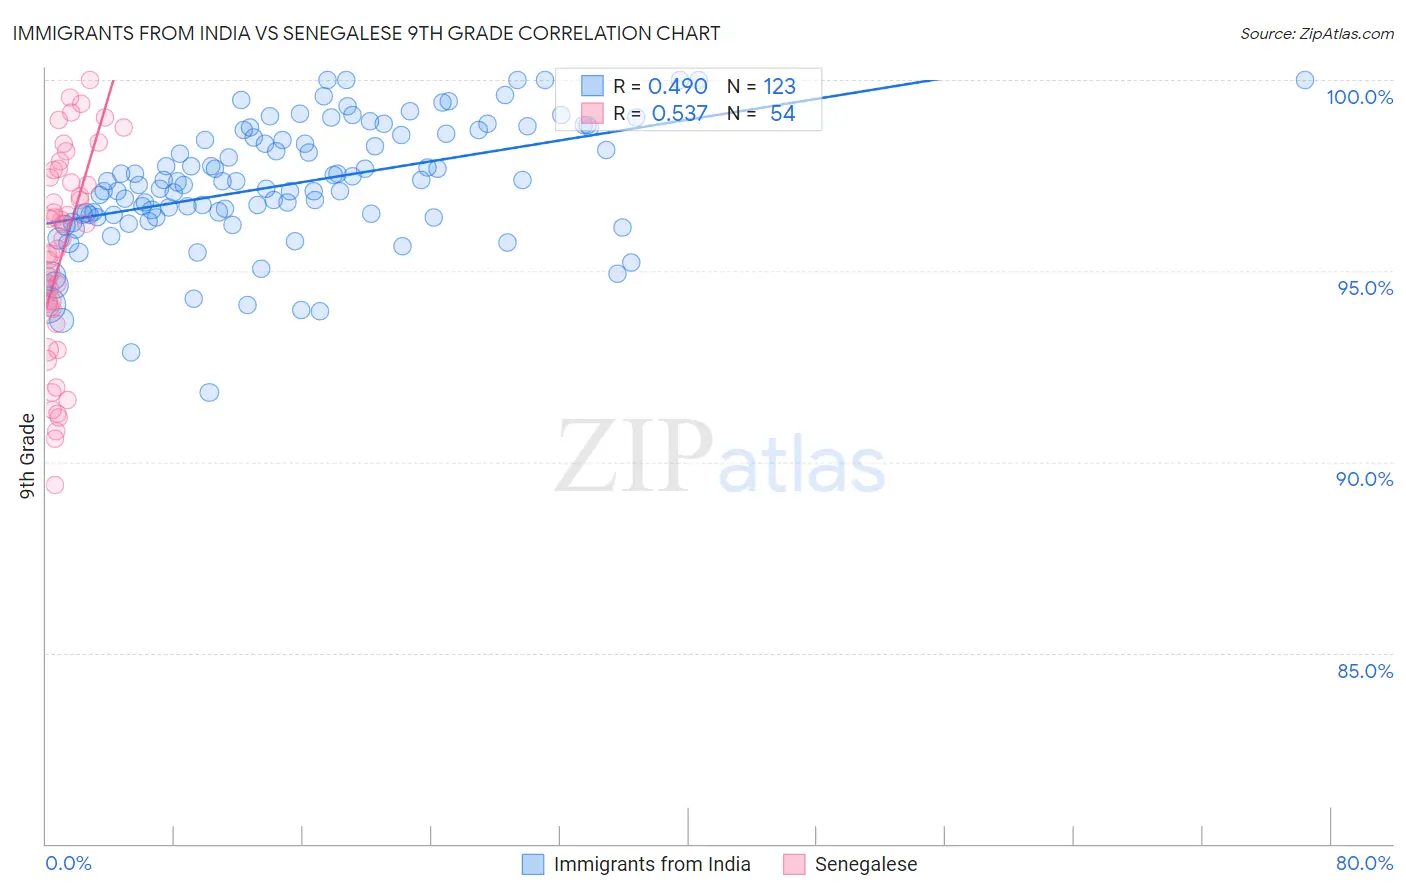
Immigrants from India vs Senegalese 9th Grade Correlation Chart
The statistical analysis conducted on geographies consisting of 434,105,844 people shows a moderate positive correlation between the proportion of Immigrants from India and percentage of population with at least 9th grade education in the United States with a correlation coefficient (R) of 0.490 and weighted average of 96.1%. Similarly, the statistical analysis conducted on geographies consisting of 78,142,569 people shows a substantial positive correlation between the proportion of Senegalese and percentage of population with at least 9th grade education in the United States with a correlation coefficient (R) of 0.537 and weighted average of 94.2%, a difference of 2.0%.
9th Grade Correlation Summary
| Measurement | Immigrants from India | Senegalese |
| Minimum | 91.8% | 89.4% |
| Maximum | 100.0% | 100.0% |
| Range | 8.2% | 10.6% |
| Mean | 97.3% | 95.4% |
| Median | 97.3% | 95.7% |
| Interquartile 25% (IQ1) | 96.4% | 94.0% |
| Interquartile 75% (IQ3) | 98.6% | 97.5% |
| Interquartile Range (IQR) | 2.2% | 3.4% |
| Standard Deviation (Sample) | 1.6% | 2.7% |
| Standard Deviation (Population) | 1.6% | 2.6% |
Similar Demographics by 9th Grade
Demographics Similar to Immigrants from India by 9th Grade
In terms of 9th grade, the demographic groups most similar to Immigrants from India are Crow (96.1%, a difference of 0.0%), Alaska Native (96.1%, a difference of 0.010%), Russian (96.0%, a difference of 0.010%), Australian (96.0%, a difference of 0.010%), and Greek (96.0%, a difference of 0.020%).
| Demographics | Rating | Rank | 9th Grade |
| Ottawa | 99.9 /100 | #39 | Exceptional 96.1% |
| Slavs | 99.9 /100 | #40 | Exceptional 96.1% |
| Czechoslovakians | 99.9 /100 | #41 | Exceptional 96.1% |
| Chippewa | 99.9 /100 | #42 | Exceptional 96.1% |
| Iranians | 99.9 /100 | #43 | Exceptional 96.1% |
| Alaska Natives | 99.9 /100 | #44 | Exceptional 96.1% |
| Crow | 99.9 /100 | #45 | Exceptional 96.1% |
| Immigrants | India | 99.9 /100 | #46 | Exceptional 96.1% |
| Russians | 99.9 /100 | #47 | Exceptional 96.0% |
| Australians | 99.9 /100 | #48 | Exceptional 96.0% |
| Greeks | 99.9 /100 | #49 | Exceptional 96.0% |
| Celtics | 99.9 /100 | #50 | Exceptional 96.0% |
| Immigrants | Northern Europe | 99.9 /100 | #51 | Exceptional 96.0% |
| Serbians | 99.9 /100 | #52 | Exceptional 96.0% |
| Austrians | 99.8 /100 | #53 | Exceptional 96.0% |
Demographics Similar to Senegalese by 9th Grade
In terms of 9th grade, the demographic groups most similar to Senegalese are Paiute (94.2%, a difference of 0.0%), Dutch West Indian (94.2%, a difference of 0.010%), Afghan (94.2%, a difference of 0.010%), Immigrants from Middle Africa (94.2%, a difference of 0.020%), and Immigrants from Cameroon (94.2%, a difference of 0.020%).
| Demographics | Rating | Rank | 9th Grade |
| Immigrants | China | 2.8 /100 | #239 | Tragic 94.3% |
| Immigrants | Ethiopia | 2.7 /100 | #240 | Tragic 94.3% |
| Spanish Americans | 2.6 /100 | #241 | Tragic 94.2% |
| Immigrants | Middle Africa | 2.2 /100 | #242 | Tragic 94.2% |
| Immigrants | Cameroon | 2.1 /100 | #243 | Tragic 94.2% |
| Dutch West Indians | 2.0 /100 | #244 | Tragic 94.2% |
| Paiute | 1.9 /100 | #245 | Tragic 94.2% |
| Senegalese | 1.9 /100 | #246 | Tragic 94.2% |
| Afghans | 1.8 /100 | #247 | Tragic 94.2% |
| Immigrants | Somalia | 1.4 /100 | #248 | Tragic 94.1% |
| Uruguayans | 1.3 /100 | #249 | Tragic 94.1% |
| Immigrants | Hong Kong | 1.3 /100 | #250 | Tragic 94.1% |
| Jamaicans | 1.0 /100 | #251 | Tragic 94.1% |
| Immigrants | Senegal | 0.9 /100 | #252 | Tragic 94.1% |
| Colombians | 0.8 /100 | #253 | Tragic 94.0% |