Immigrants from India vs Swedish 9th Grade
COMPARE
Immigrants from India
Swedish
9th Grade
9th Grade Comparison
Immigrants from India
Swedes
96.1%
9TH GRADE
99.9/ 100
METRIC RATING
46th/ 347
METRIC RANK
96.7%
9TH GRADE
100.0/ 100
METRIC RATING
5th/ 347
METRIC RANK
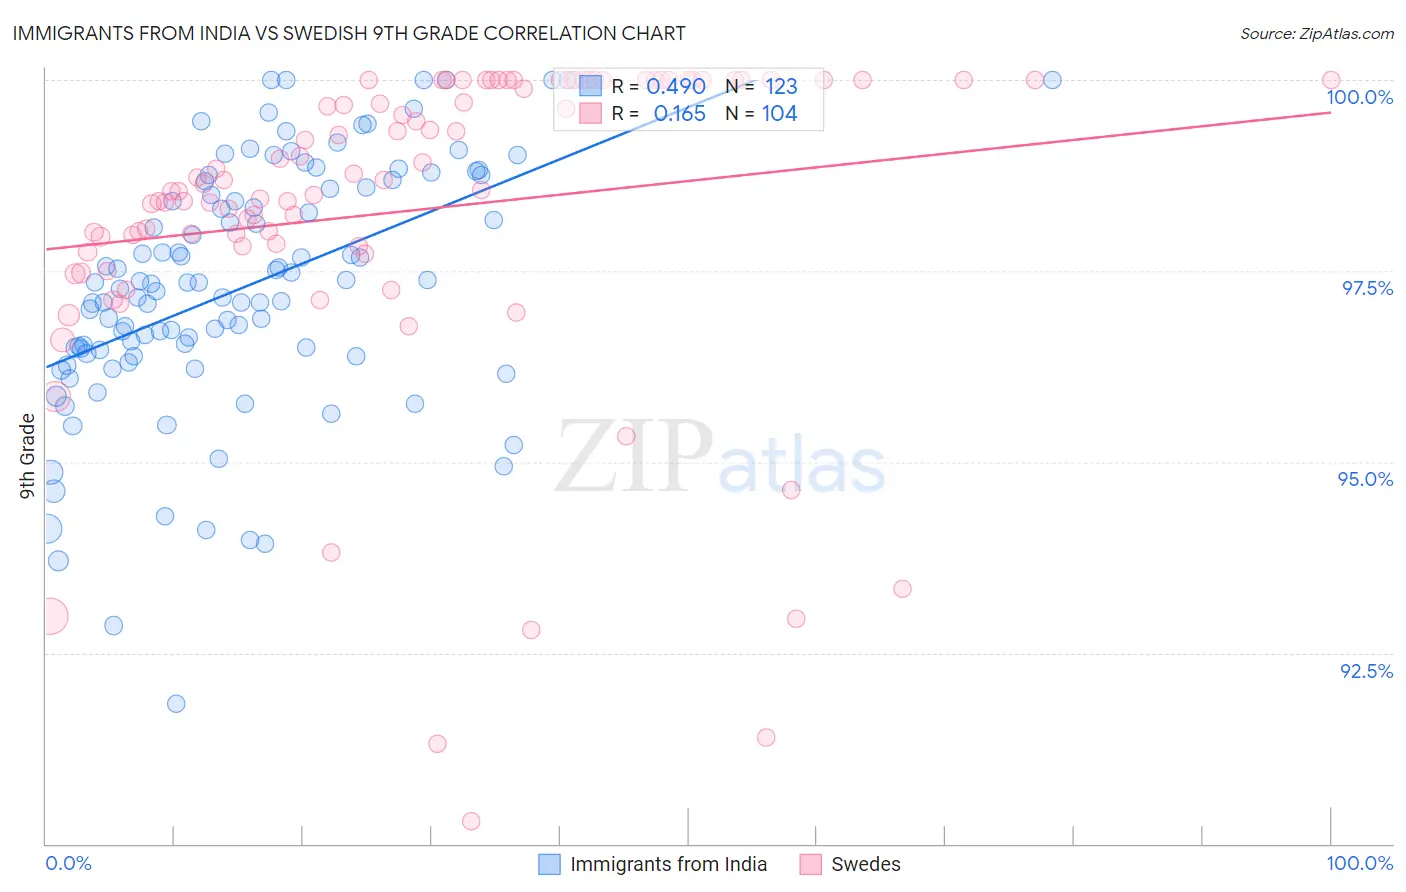
Immigrants from India vs Swedish 9th Grade Correlation Chart
The statistical analysis conducted on geographies consisting of 434,105,844 people shows a moderate positive correlation between the proportion of Immigrants from India and percentage of population with at least 9th grade education in the United States with a correlation coefficient (R) of 0.490 and weighted average of 96.1%. Similarly, the statistical analysis conducted on geographies consisting of 539,231,776 people shows a poor positive correlation between the proportion of Swedes and percentage of population with at least 9th grade education in the United States with a correlation coefficient (R) of 0.165 and weighted average of 96.7%, a difference of 0.71%.
9th Grade Correlation Summary
| Measurement | Immigrants from India | Swedish |
| Minimum | 91.8% | 90.3% |
| Maximum | 100.0% | 100.0% |
| Range | 8.2% | 9.7% |
| Mean | 97.3% | 98.3% |
| Median | 97.3% | 98.7% |
| Interquartile 25% (IQ1) | 96.4% | 97.8% |
| Interquartile 75% (IQ3) | 98.6% | 100.0% |
| Interquartile Range (IQR) | 2.2% | 2.2% |
| Standard Deviation (Sample) | 1.6% | 2.1% |
| Standard Deviation (Population) | 1.6% | 2.1% |
Similar Demographics by 9th Grade
Demographics Similar to Immigrants from India by 9th Grade
In terms of 9th grade, the demographic groups most similar to Immigrants from India are Crow (96.1%, a difference of 0.0%), Alaska Native (96.1%, a difference of 0.010%), Russian (96.0%, a difference of 0.010%), Australian (96.0%, a difference of 0.010%), and Greek (96.0%, a difference of 0.020%).
| Demographics | Rating | Rank | 9th Grade |
| Ottawa | 99.9 /100 | #39 | Exceptional 96.1% |
| Slavs | 99.9 /100 | #40 | Exceptional 96.1% |
| Czechoslovakians | 99.9 /100 | #41 | Exceptional 96.1% |
| Chippewa | 99.9 /100 | #42 | Exceptional 96.1% |
| Iranians | 99.9 /100 | #43 | Exceptional 96.1% |
| Alaska Natives | 99.9 /100 | #44 | Exceptional 96.1% |
| Crow | 99.9 /100 | #45 | Exceptional 96.1% |
| Immigrants | India | 99.9 /100 | #46 | Exceptional 96.1% |
| Russians | 99.9 /100 | #47 | Exceptional 96.0% |
| Australians | 99.9 /100 | #48 | Exceptional 96.0% |
| Greeks | 99.9 /100 | #49 | Exceptional 96.0% |
| Celtics | 99.9 /100 | #50 | Exceptional 96.0% |
| Immigrants | Northern Europe | 99.9 /100 | #51 | Exceptional 96.0% |
| Serbians | 99.9 /100 | #52 | Exceptional 96.0% |
| Austrians | 99.8 /100 | #53 | Exceptional 96.0% |
Demographics Similar to Swedes by 9th Grade
In terms of 9th grade, the demographic groups most similar to Swedes are Slovene (96.7%, a difference of 0.010%), Polish (96.7%, a difference of 0.010%), Carpatho Rusyn (96.7%, a difference of 0.010%), German (96.7%, a difference of 0.030%), and Tlingit-Haida (96.6%, a difference of 0.11%).
| Demographics | Rating | Rank | 9th Grade |
| Tsimshian | 100.0 /100 | #1 | Exceptional 97.0% |
| Norwegians | 100.0 /100 | #2 | Exceptional 96.9% |
| Slovaks | 100.0 /100 | #3 | Exceptional 96.9% |
| Slovenes | 100.0 /100 | #4 | Exceptional 96.7% |
| Swedes | 100.0 /100 | #5 | Exceptional 96.7% |
| Poles | 100.0 /100 | #6 | Exceptional 96.7% |
| Carpatho Rusyns | 100.0 /100 | #7 | Exceptional 96.7% |
| Germans | 100.0 /100 | #8 | Exceptional 96.7% |
| Tlingit-Haida | 100.0 /100 | #9 | Exceptional 96.6% |
| Lithuanians | 100.0 /100 | #10 | Exceptional 96.6% |
| Finns | 100.0 /100 | #11 | Exceptional 96.6% |
| English | 100.0 /100 | #12 | Exceptional 96.6% |
| Danes | 100.0 /100 | #13 | Exceptional 96.5% |
| Scottish | 100.0 /100 | #14 | Exceptional 96.5% |
| Irish | 100.0 /100 | #15 | Exceptional 96.5% |