Spanish vs Senegalese 9th Grade
COMPARE
Spanish
Senegalese
9th Grade
9th Grade Comparison
Spanish
Senegalese
95.2%
9TH GRADE
84.4/ 100
METRIC RATING
143rd/ 347
METRIC RANK
94.2%
9TH GRADE
1.9/ 100
METRIC RATING
246th/ 347
METRIC RANK
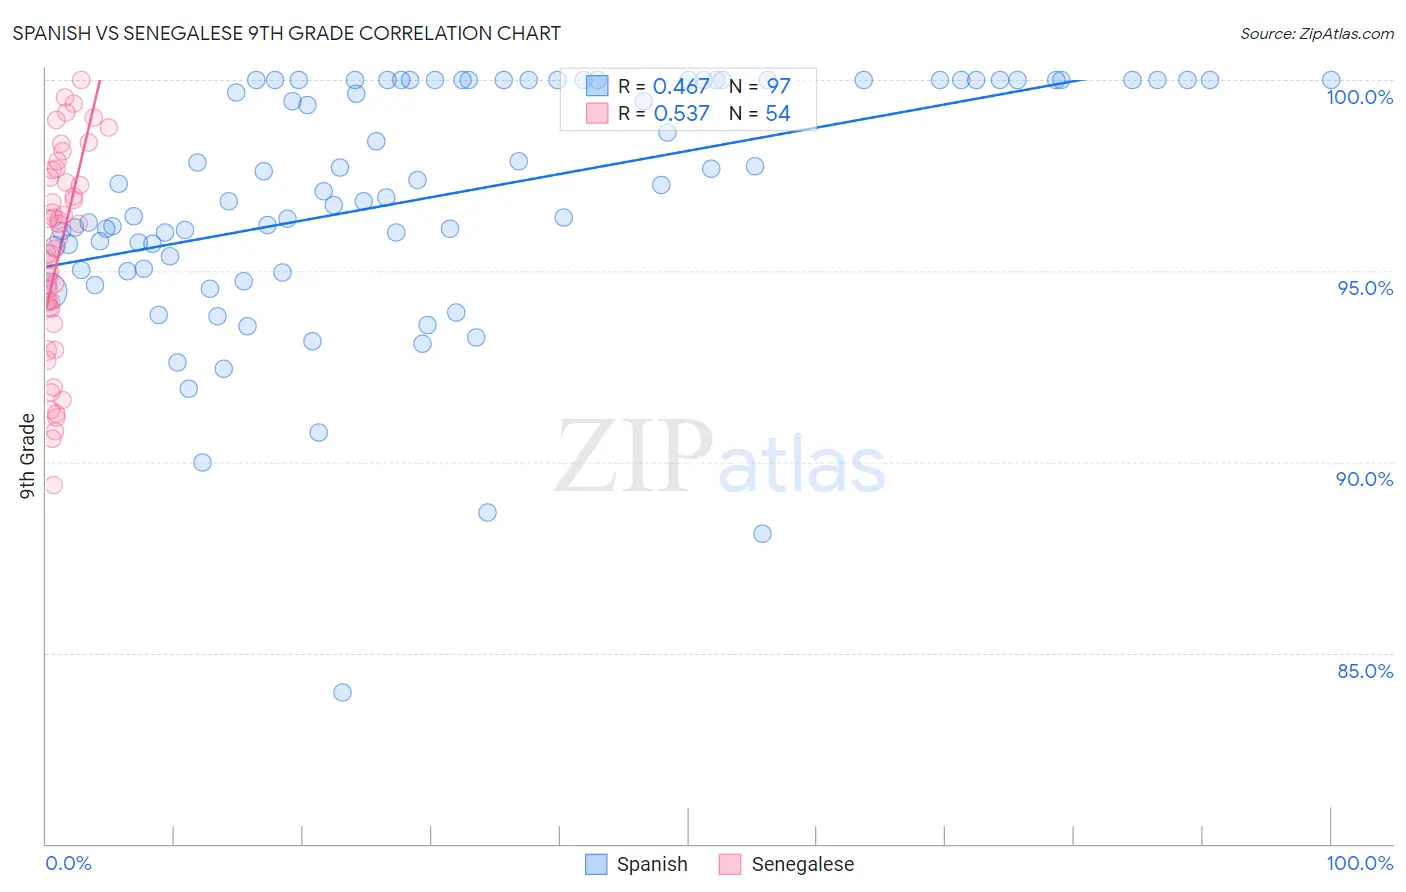
Spanish vs Senegalese 9th Grade Correlation Chart
The statistical analysis conducted on geographies consisting of 422,188,828 people shows a moderate positive correlation between the proportion of Spanish and percentage of population with at least 9th grade education in the United States with a correlation coefficient (R) of 0.467 and weighted average of 95.2%. Similarly, the statistical analysis conducted on geographies consisting of 78,142,569 people shows a substantial positive correlation between the proportion of Senegalese and percentage of population with at least 9th grade education in the United States with a correlation coefficient (R) of 0.537 and weighted average of 94.2%, a difference of 1.0%.
9th Grade Correlation Summary
| Measurement | Spanish | Senegalese |
| Minimum | 84.0% | 89.4% |
| Maximum | 100.0% | 100.0% |
| Range | 16.0% | 10.6% |
| Mean | 97.0% | 95.4% |
| Median | 97.3% | 95.7% |
| Interquartile 25% (IQ1) | 95.2% | 94.0% |
| Interquartile 75% (IQ3) | 100.0% | 97.5% |
| Interquartile Range (IQR) | 4.8% | 3.4% |
| Standard Deviation (Sample) | 3.2% | 2.7% |
| Standard Deviation (Population) | 3.2% | 2.6% |
Similar Demographics by 9th Grade
Demographics Similar to Spanish by 9th Grade
In terms of 9th grade, the demographic groups most similar to Spanish are Immigrants from Greece (95.2%, a difference of 0.0%), Immigrants from Taiwan (95.2%, a difference of 0.010%), Immigrants from Bosnia and Herzegovina (95.2%, a difference of 0.010%), Yup'ik (95.2%, a difference of 0.010%), and Immigrants from Eastern Europe (95.2%, a difference of 0.020%).
| Demographics | Rating | Rank | 9th Grade |
| Immigrants | Iran | 88.3 /100 | #136 | Excellent 95.2% |
| Hmong | 87.7 /100 | #137 | Excellent 95.2% |
| Immigrants | Russia | 86.6 /100 | #138 | Excellent 95.2% |
| Immigrants | Eastern Europe | 85.8 /100 | #139 | Excellent 95.2% |
| Immigrants | Taiwan | 85.3 /100 | #140 | Excellent 95.2% |
| Immigrants | Bosnia and Herzegovina | 85.2 /100 | #141 | Excellent 95.2% |
| Immigrants | Greece | 84.6 /100 | #142 | Excellent 95.2% |
| Spanish | 84.4 /100 | #143 | Excellent 95.2% |
| Yup'ik | 83.3 /100 | #144 | Excellent 95.2% |
| Pueblo | 82.2 /100 | #145 | Excellent 95.1% |
| Immigrants | Sri Lanka | 82.1 /100 | #146 | Excellent 95.1% |
| Choctaw | 81.9 /100 | #147 | Excellent 95.1% |
| Immigrants | Jordan | 81.2 /100 | #148 | Excellent 95.1% |
| Immigrants | Korea | 79.6 /100 | #149 | Good 95.1% |
| Kenyans | 79.1 /100 | #150 | Good 95.1% |
Demographics Similar to Senegalese by 9th Grade
In terms of 9th grade, the demographic groups most similar to Senegalese are Paiute (94.2%, a difference of 0.0%), Dutch West Indian (94.2%, a difference of 0.010%), Afghan (94.2%, a difference of 0.010%), Immigrants from Middle Africa (94.2%, a difference of 0.020%), and Immigrants from Cameroon (94.2%, a difference of 0.020%).
| Demographics | Rating | Rank | 9th Grade |
| Immigrants | China | 2.8 /100 | #239 | Tragic 94.3% |
| Immigrants | Ethiopia | 2.7 /100 | #240 | Tragic 94.3% |
| Spanish Americans | 2.6 /100 | #241 | Tragic 94.2% |
| Immigrants | Middle Africa | 2.2 /100 | #242 | Tragic 94.2% |
| Immigrants | Cameroon | 2.1 /100 | #243 | Tragic 94.2% |
| Dutch West Indians | 2.0 /100 | #244 | Tragic 94.2% |
| Paiute | 1.9 /100 | #245 | Tragic 94.2% |
| Senegalese | 1.9 /100 | #246 | Tragic 94.2% |
| Afghans | 1.8 /100 | #247 | Tragic 94.2% |
| Immigrants | Somalia | 1.4 /100 | #248 | Tragic 94.1% |
| Uruguayans | 1.3 /100 | #249 | Tragic 94.1% |
| Immigrants | Hong Kong | 1.3 /100 | #250 | Tragic 94.1% |
| Jamaicans | 1.0 /100 | #251 | Tragic 94.1% |
| Immigrants | Senegal | 0.9 /100 | #252 | Tragic 94.1% |
| Colombians | 0.8 /100 | #253 | Tragic 94.0% |