Immigrants from India vs Ethiopian 3rd Grade
COMPARE
Immigrants from India
Ethiopian
3rd Grade
3rd Grade Comparison
Immigrants from India
Ethiopians
98.1%
3RD GRADE
98.8/ 100
METRIC RATING
88th/ 347
METRIC RANK
97.4%
3RD GRADE
1.1/ 100
METRIC RATING
245th/ 347
METRIC RANK
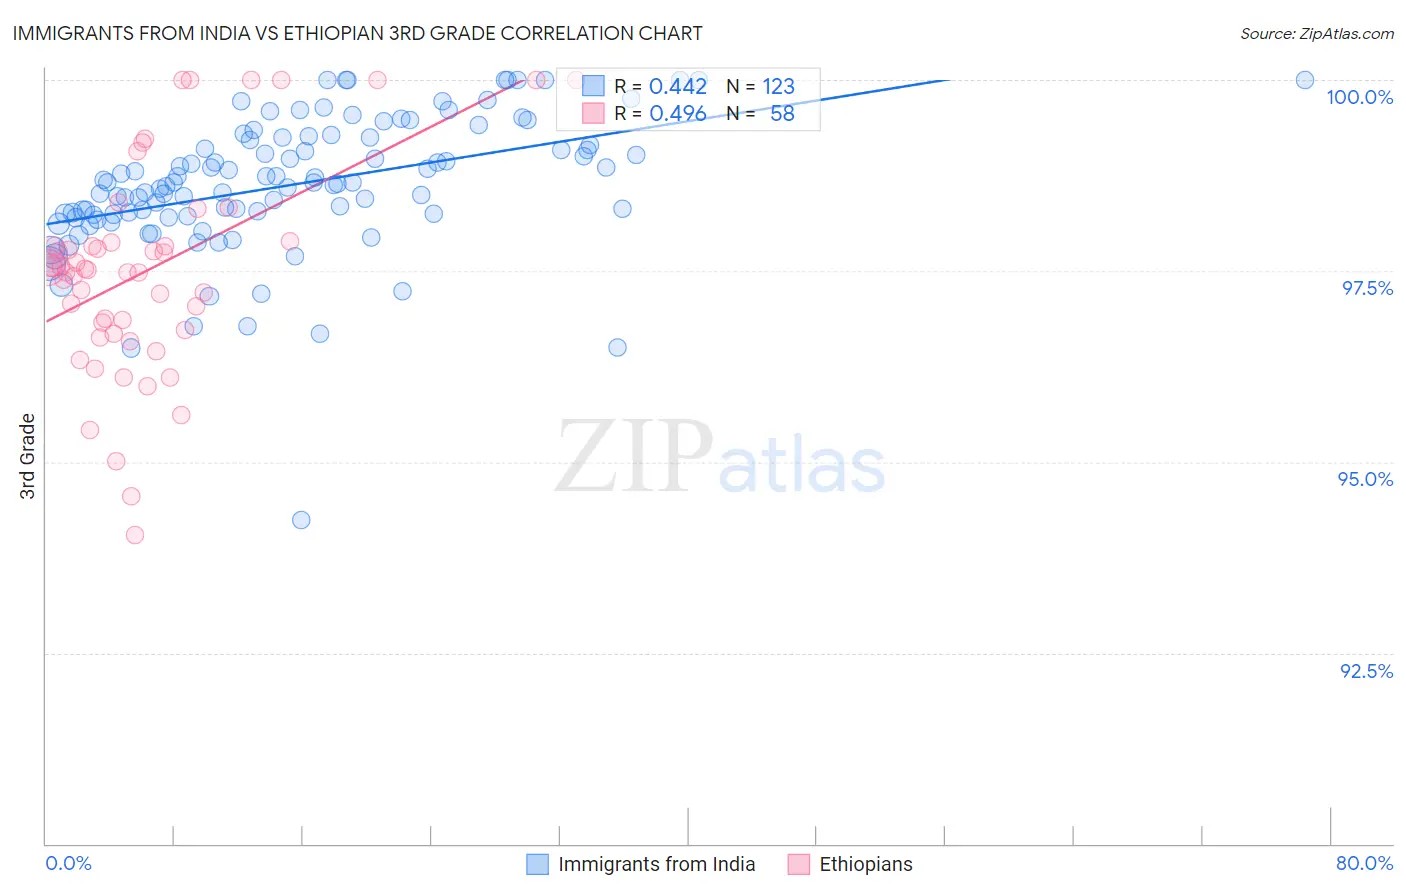
Immigrants from India vs Ethiopian 3rd Grade Correlation Chart
The statistical analysis conducted on geographies consisting of 434,105,844 people shows a moderate positive correlation between the proportion of Immigrants from India and percentage of population with at least 3rd grade education in the United States with a correlation coefficient (R) of 0.442 and weighted average of 98.1%. Similarly, the statistical analysis conducted on geographies consisting of 223,120,541 people shows a moderate positive correlation between the proportion of Ethiopians and percentage of population with at least 3rd grade education in the United States with a correlation coefficient (R) of 0.496 and weighted average of 97.4%, a difference of 0.76%.
3rd Grade Correlation Summary
| Measurement | Immigrants from India | Ethiopian |
| Minimum | 94.2% | 94.0% |
| Maximum | 100.0% | 100.0% |
| Range | 5.8% | 6.0% |
| Mean | 98.6% | 97.5% |
| Median | 98.7% | 97.5% |
| Interquartile 25% (IQ1) | 98.2% | 96.7% |
| Interquartile 75% (IQ3) | 99.2% | 97.9% |
| Interquartile Range (IQR) | 1.0% | 1.1% |
| Standard Deviation (Sample) | 0.89% | 1.4% |
| Standard Deviation (Population) | 0.89% | 1.3% |
Similar Demographics by 3rd Grade
Demographics Similar to Immigrants from India by 3rd Grade
In terms of 3rd grade, the demographic groups most similar to Immigrants from India are Immigrants from Sweden (98.1%, a difference of 0.0%), Immigrants from Australia (98.1%, a difference of 0.0%), Potawatomi (98.1%, a difference of 0.0%), Immigrants from Denmark (98.1%, a difference of 0.0%), and Delaware (98.1%, a difference of 0.0%).
| Demographics | Rating | Rank | 3rd Grade |
| Icelanders | 99.1 /100 | #81 | Exceptional 98.1% |
| Shoshone | 99.0 /100 | #82 | Exceptional 98.1% |
| Ukrainians | 98.9 /100 | #83 | Exceptional 98.1% |
| Immigrants | Sweden | 98.9 /100 | #84 | Exceptional 98.1% |
| Immigrants | Australia | 98.9 /100 | #85 | Exceptional 98.1% |
| Potawatomi | 98.9 /100 | #86 | Exceptional 98.1% |
| Immigrants | Denmark | 98.8 /100 | #87 | Exceptional 98.1% |
| Immigrants | India | 98.8 /100 | #88 | Exceptional 98.1% |
| Delaware | 98.8 /100 | #89 | Exceptional 98.1% |
| Zimbabweans | 98.8 /100 | #90 | Exceptional 98.1% |
| Hopi | 98.7 /100 | #91 | Exceptional 98.1% |
| Immigrants | South Africa | 98.7 /100 | #92 | Exceptional 98.1% |
| Immigrants | Western Europe | 98.7 /100 | #93 | Exceptional 98.1% |
| Immigrants | Germany | 98.4 /100 | #94 | Exceptional 98.1% |
| Cypriots | 98.4 /100 | #95 | Exceptional 98.1% |
Demographics Similar to Ethiopians by 3rd Grade
In terms of 3rd grade, the demographic groups most similar to Ethiopians are Asian (97.4%, a difference of 0.0%), Indian (Asian) (97.4%, a difference of 0.010%), Immigrants from Senegal (97.4%, a difference of 0.010%), Assyrian/Chaldean/Syriac (97.4%, a difference of 0.010%), and U.S. Virgin Islander (97.4%, a difference of 0.020%).
| Demographics | Rating | Rank | 3rd Grade |
| Immigrants | Uruguay | 1.7 /100 | #238 | Tragic 97.4% |
| Nigerians | 1.6 /100 | #239 | Tragic 97.4% |
| U.S. Virgin Islanders | 1.4 /100 | #240 | Tragic 97.4% |
| Immigrants | Indonesia | 1.4 /100 | #241 | Tragic 97.4% |
| Koreans | 1.3 /100 | #242 | Tragic 97.4% |
| Indians (Asian) | 1.3 /100 | #243 | Tragic 97.4% |
| Asians | 1.1 /100 | #244 | Tragic 97.4% |
| Ethiopians | 1.1 /100 | #245 | Tragic 97.4% |
| Immigrants | Senegal | 1.0 /100 | #246 | Tragic 97.4% |
| Assyrians/Chaldeans/Syriacs | 1.0 /100 | #247 | Tragic 97.4% |
| Immigrants | Eastern Africa | 0.9 /100 | #248 | Tragic 97.4% |
| South Americans | 0.9 /100 | #249 | Tragic 97.4% |
| Immigrants | Middle Africa | 0.9 /100 | #250 | Tragic 97.4% |
| Immigrants | Asia | 0.8 /100 | #251 | Tragic 97.4% |
| Peruvians | 0.8 /100 | #252 | Tragic 97.4% |