Immigrants from Europe vs Immigrants from Eastern Europe 11th Grade
COMPARE
Immigrants from Europe
Immigrants from Eastern Europe
11th Grade
11th Grade Comparison
Immigrants from Europe
Immigrants from Eastern Europe
93.5%
11TH GRADE
98.6/ 100
METRIC RATING
104th/ 347
METRIC RANK
93.2%
11TH GRADE
95.9/ 100
METRIC RATING
124th/ 347
METRIC RANK
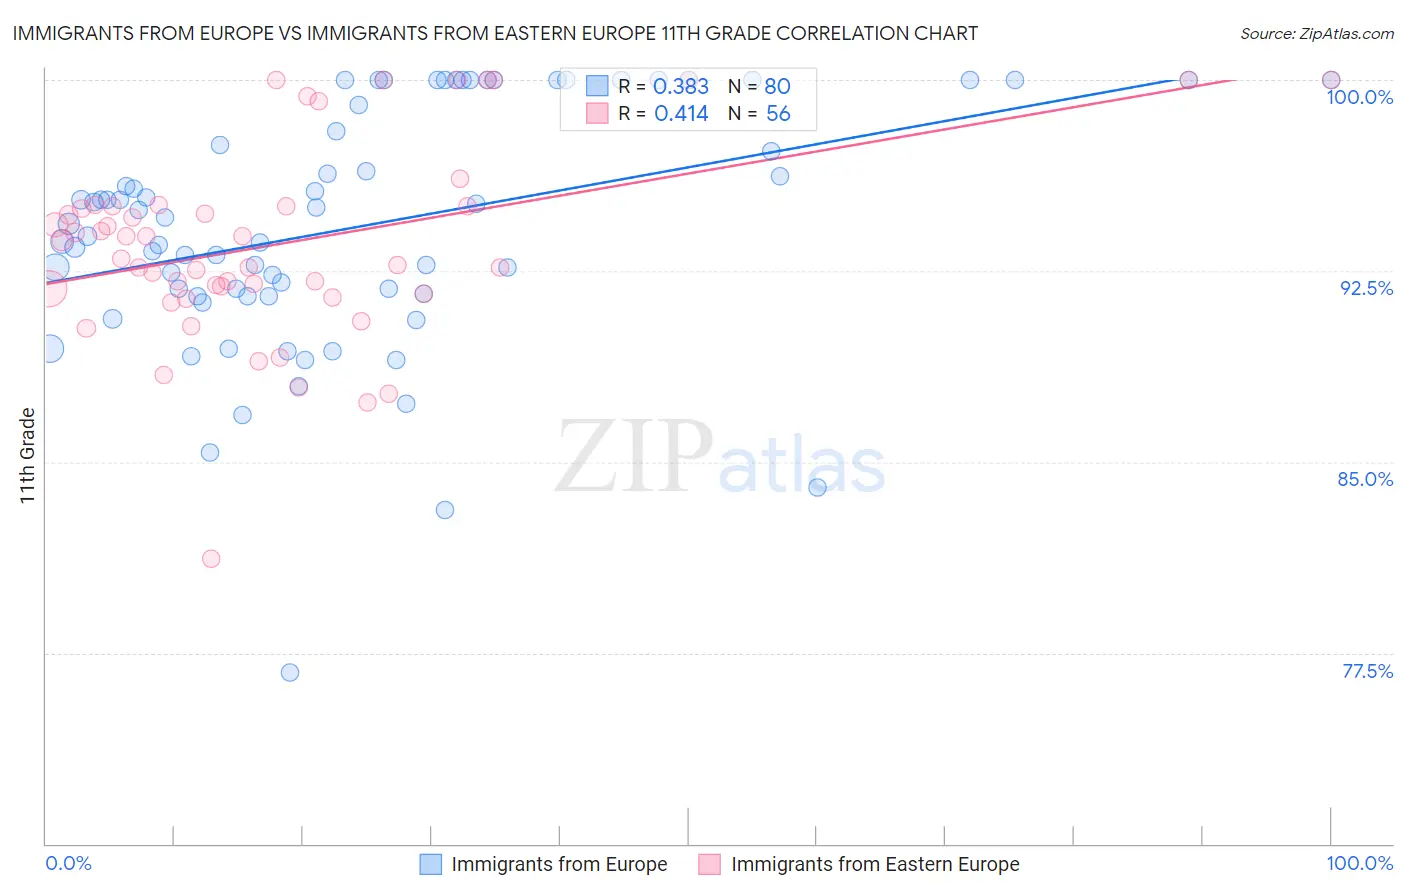
Immigrants from Europe vs Immigrants from Eastern Europe 11th Grade Correlation Chart
The statistical analysis conducted on geographies consisting of 547,425,973 people shows a mild positive correlation between the proportion of Immigrants from Europe and percentage of population with at least 11th grade education in the United States with a correlation coefficient (R) of 0.383 and weighted average of 93.5%. Similarly, the statistical analysis conducted on geographies consisting of 475,879,420 people shows a moderate positive correlation between the proportion of Immigrants from Eastern Europe and percentage of population with at least 11th grade education in the United States with a correlation coefficient (R) of 0.414 and weighted average of 93.2%, a difference of 0.27%.
11th Grade Correlation Summary
| Measurement | Immigrants from Europe | Immigrants from Eastern Europe |
| Minimum | 76.7% | 81.2% |
| Maximum | 100.0% | 100.0% |
| Range | 23.3% | 18.8% |
| Mean | 94.2% | 93.6% |
| Median | 94.5% | 93.3% |
| Interquartile 25% (IQ1) | 91.6% | 91.7% |
| Interquartile 75% (IQ3) | 99.5% | 95.0% |
| Interquartile Range (IQR) | 7.9% | 3.4% |
| Standard Deviation (Sample) | 4.8% | 3.9% |
| Standard Deviation (Population) | 4.7% | 3.8% |
Demographics Similar to Immigrants from Europe and Immigrants from Eastern Europe by 11th Grade
In terms of 11th grade, the demographic groups most similar to Immigrants from Europe are Immigrants from Serbia (93.5%, a difference of 0.0%), Immigrants from Croatia (93.5%, a difference of 0.0%), Immigrants from Norway (93.5%, a difference of 0.020%), Alaska Native (93.5%, a difference of 0.020%), and Immigrants from Kuwait (93.5%, a difference of 0.030%). Similarly, the demographic groups most similar to Immigrants from Eastern Europe are Immigrants from Greece (93.2%, a difference of 0.0%), German Russian (93.3%, a difference of 0.030%), Immigrants from Belarus (93.3%, a difference of 0.030%), Immigrants from Russia (93.3%, a difference of 0.050%), and Immigrants from Korea (93.3%, a difference of 0.080%).
| Demographics | Rating | Rank | 11th Grade |
| Immigrants | Europe | 98.6 /100 | #104 | Exceptional 93.5% |
| Immigrants | Serbia | 98.6 /100 | #105 | Exceptional 93.5% |
| Immigrants | Croatia | 98.6 /100 | #106 | Exceptional 93.5% |
| Immigrants | Norway | 98.4 /100 | #107 | Exceptional 93.5% |
| Alaska Natives | 98.4 /100 | #108 | Exceptional 93.5% |
| Immigrants | Kuwait | 98.4 /100 | #109 | Exceptional 93.5% |
| Syrians | 98.4 /100 | #110 | Exceptional 93.4% |
| Yugoslavians | 98.1 /100 | #111 | Exceptional 93.4% |
| Immigrants | Germany | 98.0 /100 | #112 | Exceptional 93.4% |
| Immigrants | Zimbabwe | 97.8 /100 | #113 | Exceptional 93.4% |
| Jordanians | 97.8 /100 | #114 | Exceptional 93.4% |
| Palestinians | 97.7 /100 | #115 | Exceptional 93.4% |
| Immigrants | Hungary | 97.5 /100 | #116 | Exceptional 93.4% |
| Whites/Caucasians | 97.4 /100 | #117 | Exceptional 93.3% |
| Immigrants | Korea | 97.0 /100 | #118 | Exceptional 93.3% |
| Israelis | 97.0 /100 | #119 | Exceptional 93.3% |
| Immigrants | Russia | 96.6 /100 | #120 | Exceptional 93.3% |
| German Russians | 96.4 /100 | #121 | Exceptional 93.3% |
| Immigrants | Belarus | 96.3 /100 | #122 | Exceptional 93.3% |
| Immigrants | Greece | 95.9 /100 | #123 | Exceptional 93.2% |
| Immigrants | Eastern Europe | 95.9 /100 | #124 | Exceptional 93.2% |