Immigrants from South Eastern Asia vs Nicaraguan 11th Grade
COMPARE
Immigrants from South Eastern Asia
Nicaraguan
11th Grade
11th Grade Comparison
Immigrants from South Eastern Asia
Nicaraguans
90.9%
11TH GRADE
0.1/ 100
METRIC RATING
275th/ 347
METRIC RANK
88.9%
11TH GRADE
0.0/ 100
METRIC RATING
318th/ 347
METRIC RANK
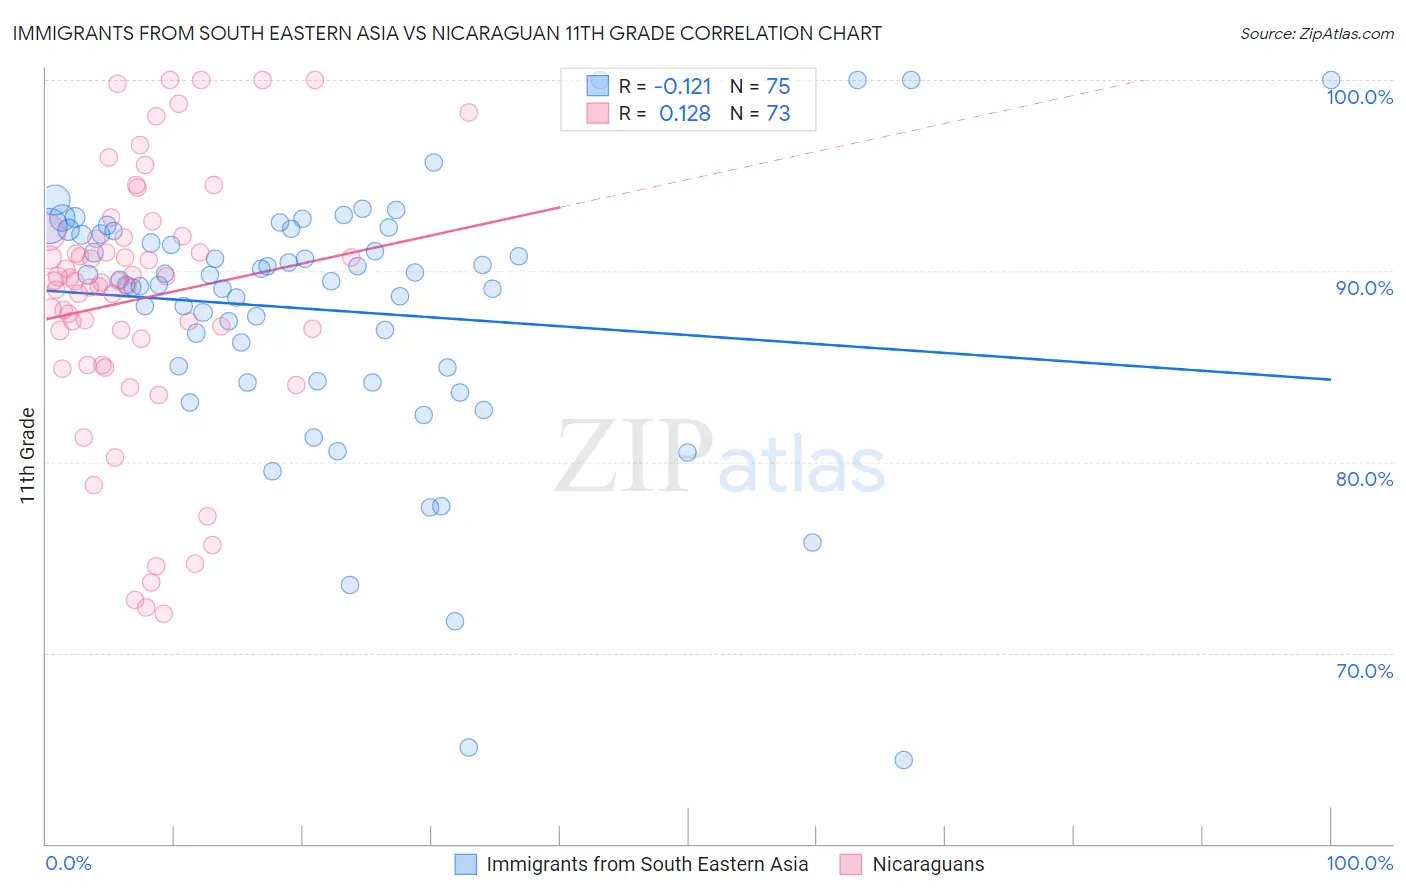
Immigrants from South Eastern Asia vs Nicaraguan 11th Grade Correlation Chart
The statistical analysis conducted on geographies consisting of 512,709,822 people shows a poor negative correlation between the proportion of Immigrants from South Eastern Asia and percentage of population with at least 11th grade education in the United States with a correlation coefficient (R) of -0.121 and weighted average of 90.9%. Similarly, the statistical analysis conducted on geographies consisting of 285,711,651 people shows a poor positive correlation between the proportion of Nicaraguans and percentage of population with at least 11th grade education in the United States with a correlation coefficient (R) of 0.128 and weighted average of 88.9%, a difference of 2.3%.
11th Grade Correlation Summary
| Measurement | Immigrants from South Eastern Asia | Nicaraguan |
| Minimum | 64.4% | 72.0% |
| Maximum | 100.0% | 100.0% |
| Range | 35.6% | 28.0% |
| Mean | 88.0% | 88.5% |
| Median | 89.5% | 89.5% |
| Interquartile 25% (IQ1) | 85.0% | 85.8% |
| Interquartile 75% (IQ3) | 92.1% | 91.8% |
| Interquartile Range (IQR) | 7.2% | 6.0% |
| Standard Deviation (Sample) | 6.8% | 6.9% |
| Standard Deviation (Population) | 6.7% | 6.8% |
Similar Demographics by 11th Grade
Demographics Similar to Immigrants from South Eastern Asia by 11th Grade
In terms of 11th grade, the demographic groups most similar to Immigrants from South Eastern Asia are Immigrants from Trinidad and Tobago (90.9%, a difference of 0.010%), Paiute (91.0%, a difference of 0.050%), Bangladeshi (90.9%, a difference of 0.070%), Immigrants from Congo (90.9%, a difference of 0.090%), and Immigrants from Peru (91.0%, a difference of 0.10%).
| Demographics | Rating | Rank | 11th Grade |
| U.S. Virgin Islanders | 0.2 /100 | #268 | Tragic 91.1% |
| Ute | 0.2 /100 | #269 | Tragic 91.1% |
| Trinidadians and Tobagonians | 0.2 /100 | #270 | Tragic 91.1% |
| Immigrants | Peru | 0.1 /100 | #271 | Tragic 91.0% |
| West Indians | 0.1 /100 | #272 | Tragic 91.0% |
| Paiute | 0.1 /100 | #273 | Tragic 91.0% |
| Immigrants | Trinidad and Tobago | 0.1 /100 | #274 | Tragic 90.9% |
| Immigrants | South Eastern Asia | 0.1 /100 | #275 | Tragic 90.9% |
| Bangladeshis | 0.1 /100 | #276 | Tragic 90.9% |
| Immigrants | Congo | 0.1 /100 | #277 | Tragic 90.9% |
| Malaysians | 0.1 /100 | #278 | Tragic 90.8% |
| Barbadians | 0.0 /100 | #279 | Tragic 90.8% |
| Sri Lankans | 0.0 /100 | #280 | Tragic 90.7% |
| Dutch West Indians | 0.0 /100 | #281 | Tragic 90.7% |
| Immigrants | St. Vincent and the Grenadines | 0.0 /100 | #282 | Tragic 90.7% |
Demographics Similar to Nicaraguans by 11th Grade
In terms of 11th grade, the demographic groups most similar to Nicaraguans are Lumbee (88.9%, a difference of 0.060%), Immigrants from Cuba (88.9%, a difference of 0.070%), Belizean (88.8%, a difference of 0.090%), Immigrants from Armenia (88.8%, a difference of 0.11%), and Immigrants from Belize (88.7%, a difference of 0.20%).
| Demographics | Rating | Rank | 11th Grade |
| Vietnamese | 0.0 /100 | #311 | Tragic 89.4% |
| Immigrants | Portugal | 0.0 /100 | #312 | Tragic 89.3% |
| Immigrants | Caribbean | 0.0 /100 | #313 | Tragic 89.1% |
| Cape Verdeans | 0.0 /100 | #314 | Tragic 89.1% |
| Immigrants | Ecuador | 0.0 /100 | #315 | Tragic 89.1% |
| Immigrants | Cuba | 0.0 /100 | #316 | Tragic 88.9% |
| Lumbee | 0.0 /100 | #317 | Tragic 88.9% |
| Nicaraguans | 0.0 /100 | #318 | Tragic 88.9% |
| Belizeans | 0.0 /100 | #319 | Tragic 88.8% |
| Immigrants | Armenia | 0.0 /100 | #320 | Tragic 88.8% |
| Immigrants | Belize | 0.0 /100 | #321 | Tragic 88.7% |
| Puerto Ricans | 0.0 /100 | #322 | Tragic 88.4% |
| Pima | 0.0 /100 | #323 | Tragic 88.3% |
| Central American Indians | 0.0 /100 | #324 | Tragic 88.2% |
| Immigrants | Nicaragua | 0.0 /100 | #325 | Tragic 88.1% |