Immigrants from Haiti vs Venezuelan 3rd Grade
COMPARE
Immigrants from Haiti
Venezuelan
3rd Grade
3rd Grade Comparison
Immigrants from Haiti
Venezuelans
96.7%
3RD GRADE
0.0/ 100
METRIC RATING
308th/ 347
METRIC RANK
97.8%
3RD GRADE
60.9/ 100
METRIC RATING
158th/ 347
METRIC RANK
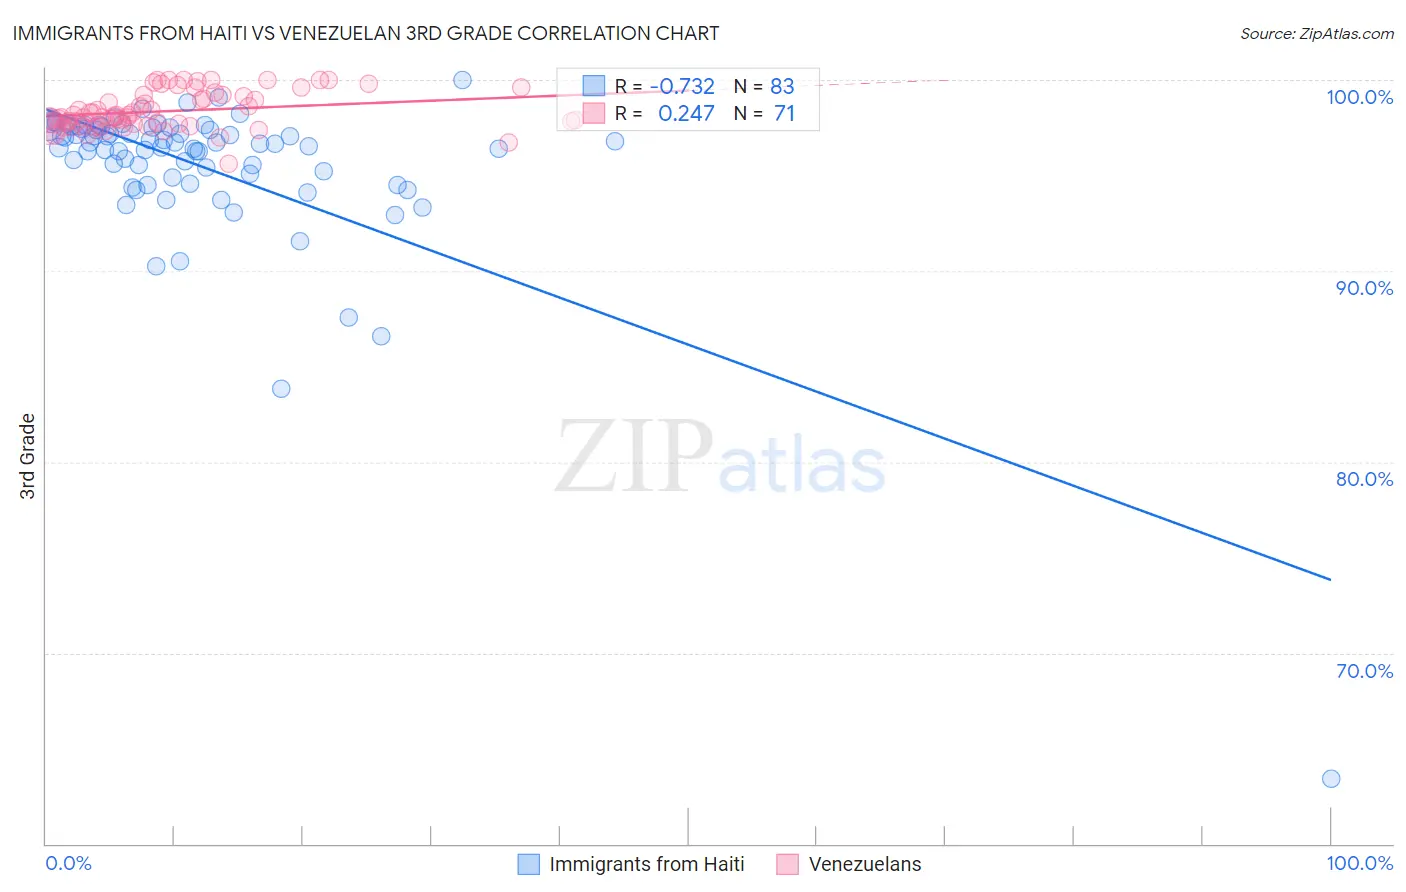
Immigrants from Haiti vs Venezuelan 3rd Grade Correlation Chart
The statistical analysis conducted on geographies consisting of 225,286,718 people shows a strong negative correlation between the proportion of Immigrants from Haiti and percentage of population with at least 3rd grade education in the United States with a correlation coefficient (R) of -0.732 and weighted average of 96.7%. Similarly, the statistical analysis conducted on geographies consisting of 306,323,638 people shows a weak positive correlation between the proportion of Venezuelans and percentage of population with at least 3rd grade education in the United States with a correlation coefficient (R) of 0.247 and weighted average of 97.8%, a difference of 1.2%.
3rd Grade Correlation Summary
| Measurement | Immigrants from Haiti | Venezuelan |
| Minimum | 63.4% | 95.6% |
| Maximum | 100.0% | 100.0% |
| Range | 36.6% | 4.4% |
| Mean | 95.5% | 98.4% |
| Median | 96.6% | 98.1% |
| Interquartile 25% (IQ1) | 94.9% | 97.7% |
| Interquartile 75% (IQ3) | 97.5% | 99.2% |
| Interquartile Range (IQR) | 2.6% | 1.5% |
| Standard Deviation (Sample) | 4.4% | 0.98% |
| Standard Deviation (Population) | 4.4% | 0.98% |
Similar Demographics by 3rd Grade
Demographics Similar to Immigrants from Haiti by 3rd Grade
In terms of 3rd grade, the demographic groups most similar to Immigrants from Haiti are Nicaraguan (96.7%, a difference of 0.0%), Sri Lankan (96.7%, a difference of 0.0%), Guyanese (96.7%, a difference of 0.020%), Cape Verdean (96.6%, a difference of 0.030%), and Central American Indian (96.7%, a difference of 0.050%).
| Demographics | Rating | Rank | 3rd Grade |
| Immigrants | Cuba | 0.0 /100 | #301 | Tragic 96.8% |
| Immigrants | Somalia | 0.0 /100 | #302 | Tragic 96.8% |
| Ecuadorians | 0.0 /100 | #303 | Tragic 96.7% |
| Immigrants | Caribbean | 0.0 /100 | #304 | Tragic 96.7% |
| Central American Indians | 0.0 /100 | #305 | Tragic 96.7% |
| Guyanese | 0.0 /100 | #306 | Tragic 96.7% |
| Nicaraguans | 0.0 /100 | #307 | Tragic 96.7% |
| Immigrants | Haiti | 0.0 /100 | #308 | Tragic 96.7% |
| Sri Lankans | 0.0 /100 | #309 | Tragic 96.7% |
| Cape Verdeans | 0.0 /100 | #310 | Tragic 96.6% |
| Immigrants | Guyana | 0.0 /100 | #311 | Tragic 96.6% |
| Immigrants | Laos | 0.0 /100 | #312 | Tragic 96.6% |
| Immigrants | Ecuador | 0.0 /100 | #313 | Tragic 96.6% |
| Belizeans | 0.0 /100 | #314 | Tragic 96.6% |
| Immigrants | Azores | 0.0 /100 | #315 | Tragic 96.6% |
Demographics Similar to Venezuelans by 3rd Grade
In terms of 3rd grade, the demographic groups most similar to Venezuelans are Immigrants from Russia (97.8%, a difference of 0.0%), Immigrants from Italy (97.8%, a difference of 0.0%), French American Indian (97.8%, a difference of 0.0%), Immigrants from Eastern Europe (97.8%, a difference of 0.010%), and Bermudan (97.8%, a difference of 0.010%).
| Demographics | Rating | Rank | 3rd Grade |
| Soviet Union | 72.6 /100 | #151 | Good 97.8% |
| Immigrants | South Central Asia | 69.5 /100 | #152 | Good 97.8% |
| Apache | 68.5 /100 | #153 | Good 97.8% |
| Immigrants | Eastern Europe | 64.1 /100 | #154 | Good 97.8% |
| Bermudans | 62.6 /100 | #155 | Good 97.8% |
| Immigrants | Russia | 61.7 /100 | #156 | Good 97.8% |
| Immigrants | Italy | 61.2 /100 | #157 | Good 97.8% |
| Venezuelans | 60.9 /100 | #158 | Good 97.8% |
| French American Indians | 60.0 /100 | #159 | Average 97.8% |
| Immigrants | Iran | 59.1 /100 | #160 | Average 97.8% |
| Albanians | 58.8 /100 | #161 | Average 97.8% |
| Immigrants | Jordan | 57.9 /100 | #162 | Average 97.8% |
| Marshallese | 57.2 /100 | #163 | Average 97.8% |
| Immigrants | Bosnia and Herzegovina | 56.2 /100 | #164 | Average 97.8% |
| Ugandans | 56.1 /100 | #165 | Average 97.8% |