Immigrants from Haiti vs Hawaiian College, Under 1 year
COMPARE
Immigrants from Haiti
Hawaiian
College, Under 1 year
College, Under 1 year Comparison
Immigrants from Haiti
Hawaiians
56.9%
COLLEGE, UNDER 1 YEAR
0.0/ 100
METRIC RATING
318th/ 347
METRIC RANK
62.1%
COLLEGE, UNDER 1 YEAR
1.1/ 100
METRIC RATING
243rd/ 347
METRIC RANK
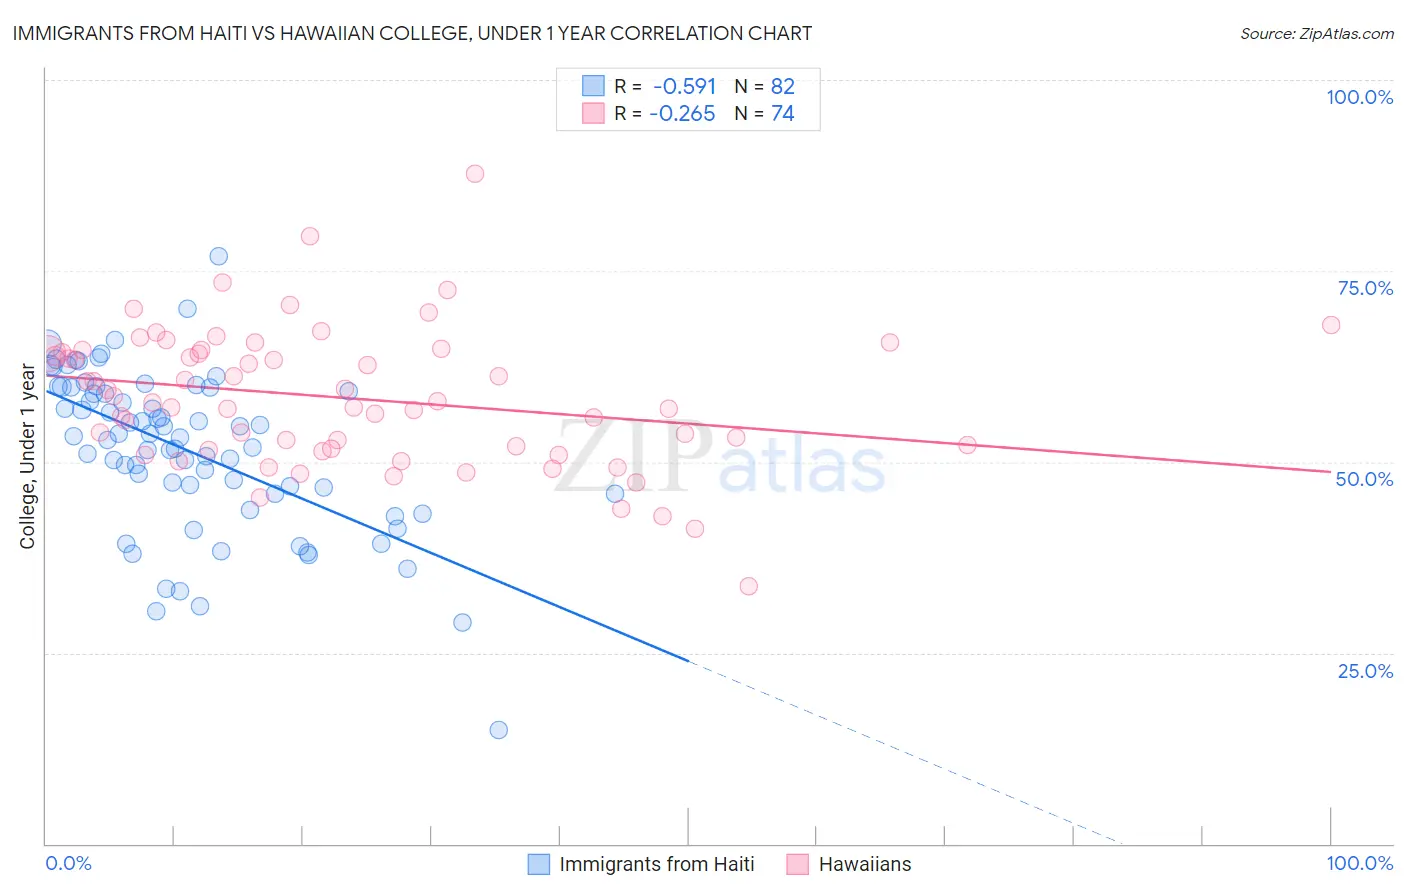
Immigrants from Haiti vs Hawaiian College, Under 1 year Correlation Chart
The statistical analysis conducted on geographies consisting of 225,287,293 people shows a substantial negative correlation between the proportion of Immigrants from Haiti and percentage of population with at least college, under 1 year education in the United States with a correlation coefficient (R) of -0.591 and weighted average of 56.9%. Similarly, the statistical analysis conducted on geographies consisting of 327,620,447 people shows a weak negative correlation between the proportion of Hawaiians and percentage of population with at least college, under 1 year education in the United States with a correlation coefficient (R) of -0.265 and weighted average of 62.1%, a difference of 9.1%.
College, Under 1 year Correlation Summary
| Measurement | Immigrants from Haiti | Hawaiian |
| Minimum | 14.8% | 33.7% |
| Maximum | 76.9% | 87.7% |
| Range | 62.1% | 54.1% |
| Mean | 51.5% | 58.4% |
| Median | 53.3% | 57.8% |
| Interquartile 25% (IQ1) | 45.9% | 51.7% |
| Interquartile 75% (IQ3) | 59.7% | 64.3% |
| Interquartile Range (IQR) | 13.8% | 12.6% |
| Standard Deviation (Sample) | 10.6% | 9.0% |
| Standard Deviation (Population) | 10.5% | 9.0% |
Similar Demographics by College, Under 1 year
Demographics Similar to Immigrants from Haiti by College, Under 1 year
In terms of college, under 1 year, the demographic groups most similar to Immigrants from Haiti are Hispanic or Latino (57.0%, a difference of 0.12%), Menominee (57.0%, a difference of 0.16%), Puerto Rican (56.8%, a difference of 0.20%), Honduran (57.1%, a difference of 0.21%), and Hopi (57.1%, a difference of 0.25%).
| Demographics | Rating | Rank | College, Under 1 year |
| Cajuns | 0.0 /100 | #311 | Tragic 57.3% |
| Salvadorans | 0.0 /100 | #312 | Tragic 57.3% |
| Dutch West Indians | 0.0 /100 | #313 | Tragic 57.2% |
| Hopi | 0.0 /100 | #314 | Tragic 57.1% |
| Hondurans | 0.0 /100 | #315 | Tragic 57.1% |
| Menominee | 0.0 /100 | #316 | Tragic 57.0% |
| Hispanics or Latinos | 0.0 /100 | #317 | Tragic 57.0% |
| Immigrants | Haiti | 0.0 /100 | #318 | Tragic 56.9% |
| Puerto Ricans | 0.0 /100 | #319 | Tragic 56.8% |
| Guatemalans | 0.0 /100 | #320 | Tragic 56.8% |
| Natives/Alaskans | 0.0 /100 | #321 | Tragic 56.6% |
| Immigrants | Caribbean | 0.0 /100 | #322 | Tragic 56.6% |
| Immigrants | Honduras | 0.0 /100 | #323 | Tragic 56.5% |
| Immigrants | El Salvador | 0.0 /100 | #324 | Tragic 56.4% |
| Immigrants | Latin America | 0.0 /100 | #325 | Tragic 56.3% |
Demographics Similar to Hawaiians by College, Under 1 year
In terms of college, under 1 year, the demographic groups most similar to Hawaiians are Malaysian (62.2%, a difference of 0.030%), Ottawa (62.2%, a difference of 0.080%), Nepalese (62.2%, a difference of 0.090%), Aleut (62.2%, a difference of 0.090%), and Colville (62.1%, a difference of 0.090%).
| Demographics | Rating | Rank | College, Under 1 year |
| Immigrants | Immigrants | 1.7 /100 | #236 | Tragic 62.5% |
| Immigrants | Burma/Myanmar | 1.6 /100 | #237 | Tragic 62.5% |
| French American Indians | 1.5 /100 | #238 | Tragic 62.4% |
| Nepalese | 1.1 /100 | #239 | Tragic 62.2% |
| Aleuts | 1.1 /100 | #240 | Tragic 62.2% |
| Ottawa | 1.1 /100 | #241 | Tragic 62.2% |
| Malaysians | 1.1 /100 | #242 | Tragic 62.2% |
| Hawaiians | 1.1 /100 | #243 | Tragic 62.1% |
| Colville | 1.0 /100 | #244 | Tragic 62.1% |
| Delaware | 0.9 /100 | #245 | Tragic 62.1% |
| Marshallese | 0.8 /100 | #246 | Tragic 61.9% |
| Immigrants | Liberia | 0.8 /100 | #247 | Tragic 61.9% |
| Potawatomi | 0.6 /100 | #248 | Tragic 61.8% |
| Vietnamese | 0.5 /100 | #249 | Tragic 61.7% |
| Immigrants | Congo | 0.5 /100 | #250 | Tragic 61.7% |