Immigrants from Haiti vs Liberian College, Under 1 year
COMPARE
Immigrants from Haiti
Liberian
College, Under 1 year
College, Under 1 year Comparison
Immigrants from Haiti
Liberians
56.9%
COLLEGE, UNDER 1 YEAR
0.0/ 100
METRIC RATING
318th/ 347
METRIC RANK
63.0%
COLLEGE, UNDER 1 YEAR
3.2/ 100
METRIC RATING
229th/ 347
METRIC RANK
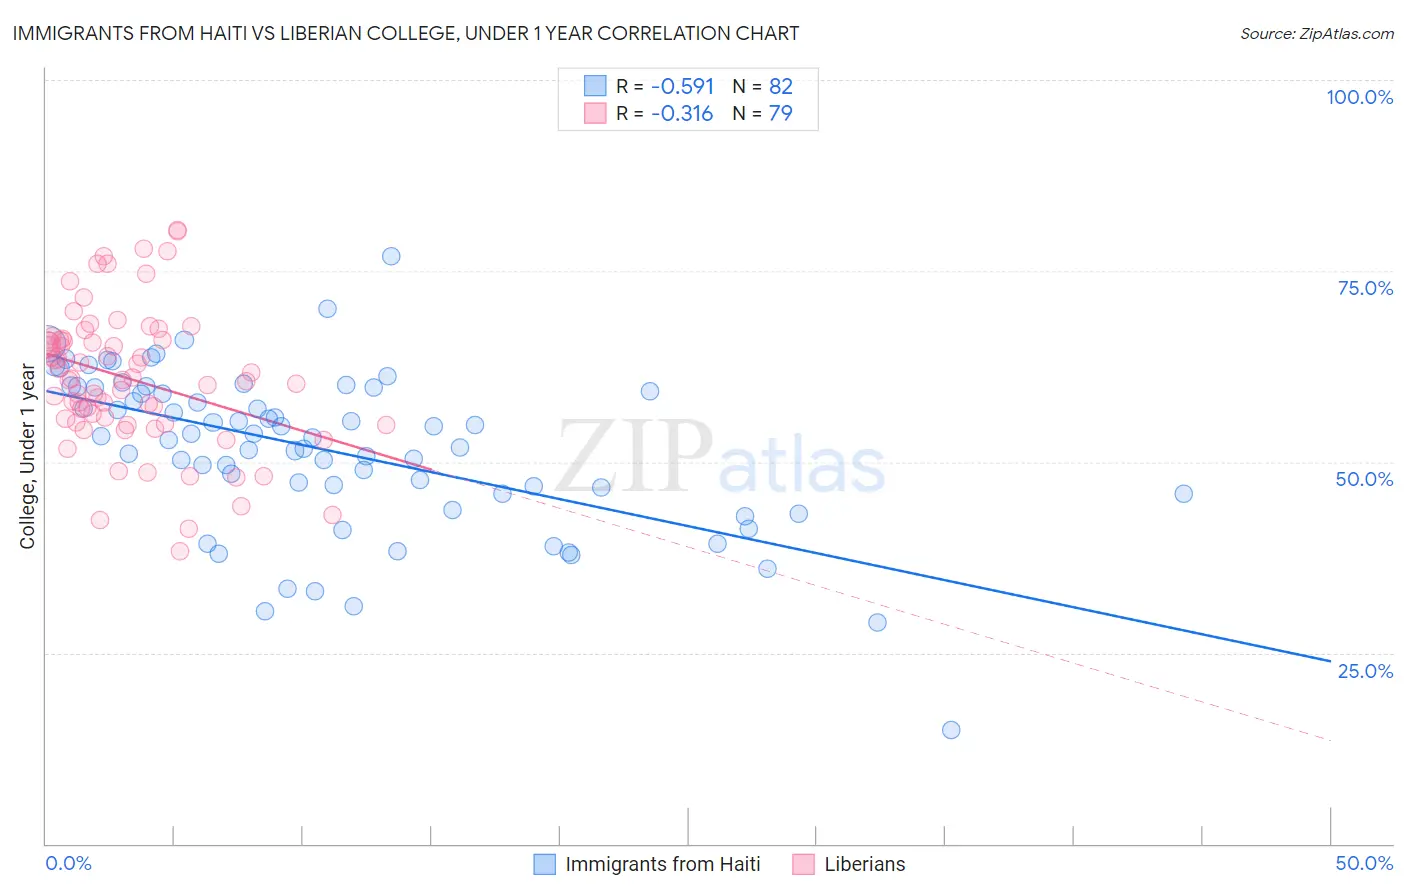
Immigrants from Haiti vs Liberian College, Under 1 year Correlation Chart
The statistical analysis conducted on geographies consisting of 225,287,293 people shows a substantial negative correlation between the proportion of Immigrants from Haiti and percentage of population with at least college, under 1 year education in the United States with a correlation coefficient (R) of -0.591 and weighted average of 56.9%. Similarly, the statistical analysis conducted on geographies consisting of 118,090,659 people shows a mild negative correlation between the proportion of Liberians and percentage of population with at least college, under 1 year education in the United States with a correlation coefficient (R) of -0.316 and weighted average of 63.0%, a difference of 10.5%.
College, Under 1 year Correlation Summary
| Measurement | Immigrants from Haiti | Liberian |
| Minimum | 14.8% | 38.3% |
| Maximum | 76.9% | 80.3% |
| Range | 62.1% | 42.0% |
| Mean | 51.5% | 60.9% |
| Median | 53.3% | 60.8% |
| Interquartile 25% (IQ1) | 45.9% | 55.2% |
| Interquartile 75% (IQ3) | 59.7% | 66.0% |
| Interquartile Range (IQR) | 13.8% | 10.8% |
| Standard Deviation (Sample) | 10.6% | 9.1% |
| Standard Deviation (Population) | 10.5% | 9.0% |
Similar Demographics by College, Under 1 year
Demographics Similar to Immigrants from Haiti by College, Under 1 year
In terms of college, under 1 year, the demographic groups most similar to Immigrants from Haiti are Hispanic or Latino (57.0%, a difference of 0.12%), Menominee (57.0%, a difference of 0.16%), Puerto Rican (56.8%, a difference of 0.20%), Honduran (57.1%, a difference of 0.21%), and Hopi (57.1%, a difference of 0.25%).
| Demographics | Rating | Rank | College, Under 1 year |
| Cajuns | 0.0 /100 | #311 | Tragic 57.3% |
| Salvadorans | 0.0 /100 | #312 | Tragic 57.3% |
| Dutch West Indians | 0.0 /100 | #313 | Tragic 57.2% |
| Hopi | 0.0 /100 | #314 | Tragic 57.1% |
| Hondurans | 0.0 /100 | #315 | Tragic 57.1% |
| Menominee | 0.0 /100 | #316 | Tragic 57.0% |
| Hispanics or Latinos | 0.0 /100 | #317 | Tragic 57.0% |
| Immigrants | Haiti | 0.0 /100 | #318 | Tragic 56.9% |
| Puerto Ricans | 0.0 /100 | #319 | Tragic 56.8% |
| Guatemalans | 0.0 /100 | #320 | Tragic 56.8% |
| Natives/Alaskans | 0.0 /100 | #321 | Tragic 56.6% |
| Immigrants | Caribbean | 0.0 /100 | #322 | Tragic 56.6% |
| Immigrants | Honduras | 0.0 /100 | #323 | Tragic 56.5% |
| Immigrants | El Salvador | 0.0 /100 | #324 | Tragic 56.4% |
| Immigrants | Latin America | 0.0 /100 | #325 | Tragic 56.3% |
Demographics Similar to Liberians by College, Under 1 year
In terms of college, under 1 year, the demographic groups most similar to Liberians are Samoan (63.0%, a difference of 0.050%), Nonimmigrants (62.9%, a difference of 0.070%), Immigrants from Ghana (63.1%, a difference of 0.17%), Immigrants from Colombia (63.1%, a difference of 0.26%), and Immigrants from Peru (63.1%, a difference of 0.27%).
| Demographics | Rating | Rank | College, Under 1 year |
| Immigrants | Senegal | 5.0 /100 | #222 | Tragic 63.3% |
| Immigrants | Costa Rica | 4.5 /100 | #223 | Tragic 63.2% |
| Sub-Saharan Africans | 4.4 /100 | #224 | Tragic 63.2% |
| Immigrants | Peru | 4.0 /100 | #225 | Tragic 63.1% |
| Immigrants | Colombia | 4.0 /100 | #226 | Tragic 63.1% |
| Immigrants | Ghana | 3.7 /100 | #227 | Tragic 63.1% |
| Samoans | 3.3 /100 | #228 | Tragic 63.0% |
| Liberians | 3.2 /100 | #229 | Tragic 63.0% |
| Immigrants | Nonimmigrants | 3.0 /100 | #230 | Tragic 62.9% |
| Immigrants | Western Africa | 2.4 /100 | #231 | Tragic 62.8% |
| Osage | 2.2 /100 | #232 | Tragic 62.7% |
| Iroquois | 2.0 /100 | #233 | Tragic 62.6% |
| Chippewa | 2.0 /100 | #234 | Tragic 62.6% |
| Spanish Americans | 1.9 /100 | #235 | Tragic 62.6% |
| Immigrants | Immigrants | 1.7 /100 | #236 | Tragic 62.5% |