Immigrants from Grenada vs Liberian 1st Grade
COMPARE
Immigrants from Grenada
Liberian
1st Grade
1st Grade Comparison
Immigrants from Grenada
Liberians
97.2%
1ST GRADE
0.0/ 100
METRIC RATING
294th/ 347
METRIC RANK
97.6%
1ST GRADE
1.4/ 100
METRIC RATING
241st/ 347
METRIC RANK
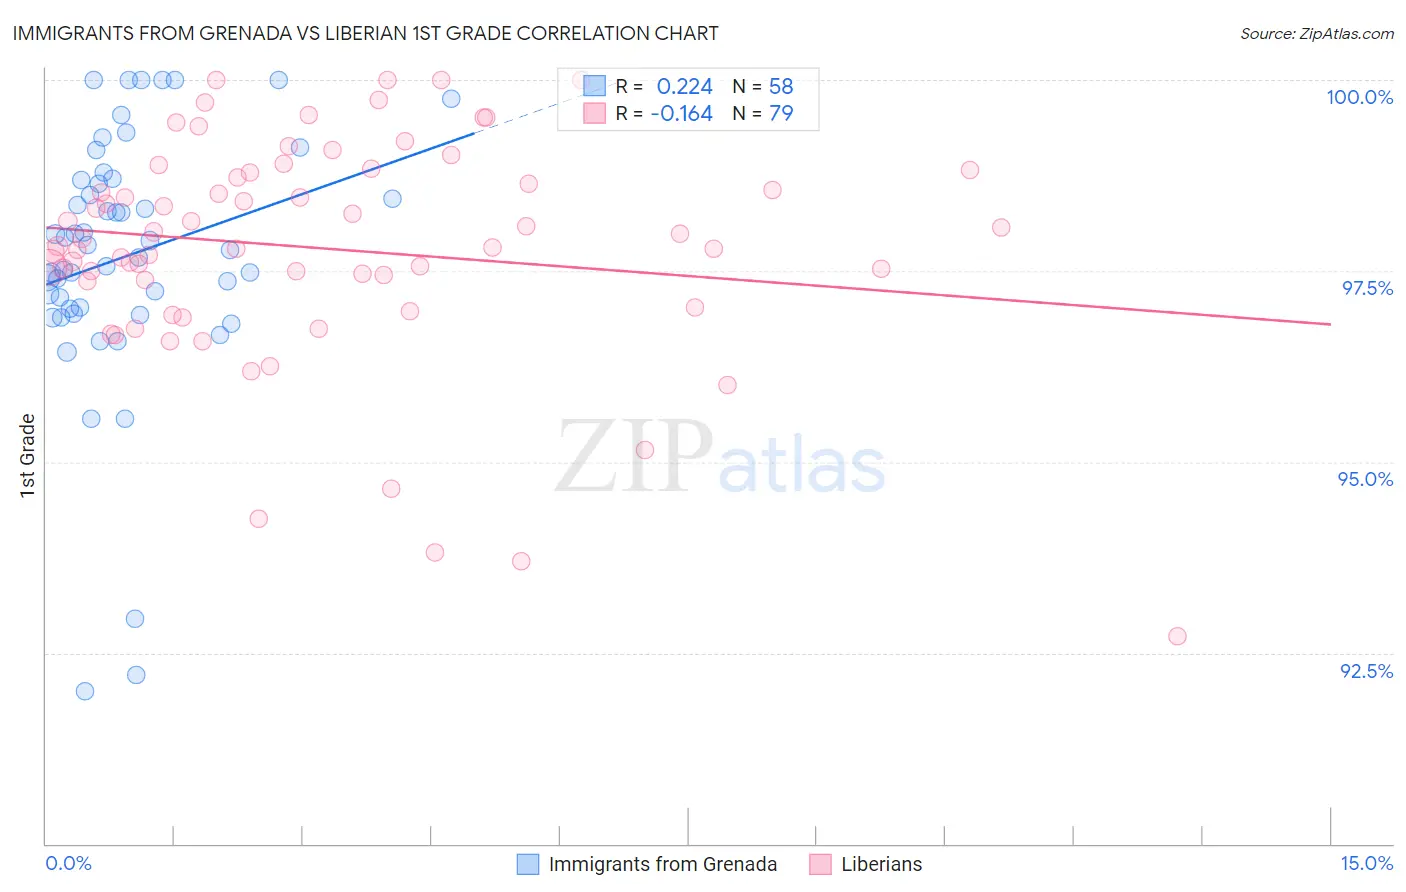
Immigrants from Grenada vs Liberian 1st Grade Correlation Chart
The statistical analysis conducted on geographies consisting of 67,200,336 people shows a weak positive correlation between the proportion of Immigrants from Grenada and percentage of population with at least 1st grade education in the United States with a correlation coefficient (R) of 0.224 and weighted average of 97.2%. Similarly, the statistical analysis conducted on geographies consisting of 118,100,194 people shows a poor negative correlation between the proportion of Liberians and percentage of population with at least 1st grade education in the United States with a correlation coefficient (R) of -0.164 and weighted average of 97.6%, a difference of 0.43%.
1st Grade Correlation Summary
| Measurement | Immigrants from Grenada | Liberian |
| Minimum | 92.0% | 92.7% |
| Maximum | 100.0% | 100.0% |
| Range | 8.0% | 7.3% |
| Mean | 97.7% | 97.8% |
| Median | 97.8% | 97.8% |
| Interquartile 25% (IQ1) | 97.0% | 97.4% |
| Interquartile 75% (IQ3) | 98.7% | 98.8% |
| Interquartile Range (IQR) | 1.7% | 1.4% |
| Standard Deviation (Sample) | 1.7% | 1.5% |
| Standard Deviation (Population) | 1.7% | 1.5% |
Similar Demographics by 1st Grade
Demographics Similar to Immigrants from Grenada by 1st Grade
In terms of 1st grade, the demographic groups most similar to Immigrants from Grenada are Immigrants (97.2%, a difference of 0.010%), Immigrants from Eritrea (97.2%, a difference of 0.010%), Malaysian (97.2%, a difference of 0.020%), British West Indian (97.2%, a difference of 0.040%), and Houma (97.2%, a difference of 0.060%).
| Demographics | Rating | Rank | 1st Grade |
| Immigrants | Hong Kong | 0.0 /100 | #287 | Tragic 97.3% |
| Immigrants | Thailand | 0.0 /100 | #288 | Tragic 97.3% |
| Immigrants | Afghanistan | 0.0 /100 | #289 | Tragic 97.3% |
| Immigrants | St. Vincent and the Grenadines | 0.0 /100 | #290 | Tragic 97.3% |
| Houma | 0.0 /100 | #291 | Tragic 97.2% |
| British West Indians | 0.0 /100 | #292 | Tragic 97.2% |
| Malaysians | 0.0 /100 | #293 | Tragic 97.2% |
| Immigrants | Grenada | 0.0 /100 | #294 | Tragic 97.2% |
| Immigrants | Immigrants | 0.0 /100 | #295 | Tragic 97.2% |
| Immigrants | Eritrea | 0.0 /100 | #296 | Tragic 97.2% |
| Central American Indians | 0.0 /100 | #297 | Tragic 97.1% |
| Immigrants | Dominica | 0.0 /100 | #298 | Tragic 97.1% |
| Immigrants | Cuba | 0.0 /100 | #299 | Tragic 97.1% |
| Haitians | 0.0 /100 | #300 | Tragic 97.1% |
| Immigrants | South Eastern Asia | 0.0 /100 | #301 | Tragic 97.1% |
Demographics Similar to Liberians by 1st Grade
In terms of 1st grade, the demographic groups most similar to Liberians are Korean (97.6%, a difference of 0.0%), Immigrants from Eastern Asia (97.6%, a difference of 0.010%), Immigrants from Indonesia (97.6%, a difference of 0.010%), Bolivian (97.6%, a difference of 0.010%), and U.S. Virgin Islander (97.6%, a difference of 0.020%).
| Demographics | Rating | Rank | 1st Grade |
| Colombians | 2.2 /100 | #234 | Tragic 97.6% |
| Immigrants | Malaysia | 2.1 /100 | #235 | Tragic 97.6% |
| Immigrants | Western Asia | 2.1 /100 | #236 | Tragic 97.6% |
| U.S. Virgin Islanders | 1.9 /100 | #237 | Tragic 97.6% |
| Nigerians | 1.8 /100 | #238 | Tragic 97.6% |
| Immigrants | Eastern Asia | 1.6 /100 | #239 | Tragic 97.6% |
| Koreans | 1.5 /100 | #240 | Tragic 97.6% |
| Liberians | 1.4 /100 | #241 | Tragic 97.6% |
| Immigrants | Indonesia | 1.2 /100 | #242 | Tragic 97.6% |
| Bolivians | 1.2 /100 | #243 | Tragic 97.6% |
| Asians | 1.1 /100 | #244 | Tragic 97.6% |
| South Americans | 1.1 /100 | #245 | Tragic 97.6% |
| Immigrants | Eastern Africa | 1.0 /100 | #246 | Tragic 97.6% |
| Peruvians | 1.0 /100 | #247 | Tragic 97.6% |
| Immigrants | Middle Africa | 1.0 /100 | #248 | Tragic 97.6% |