Celtic vs Liberian 1st Grade
COMPARE
Celtic
Liberian
1st Grade
1st Grade Comparison
Celtics
Liberians
98.4%
1ST GRADE
99.8/ 100
METRIC RATING
49th/ 347
METRIC RANK
97.6%
1ST GRADE
1.4/ 100
METRIC RATING
241st/ 347
METRIC RANK
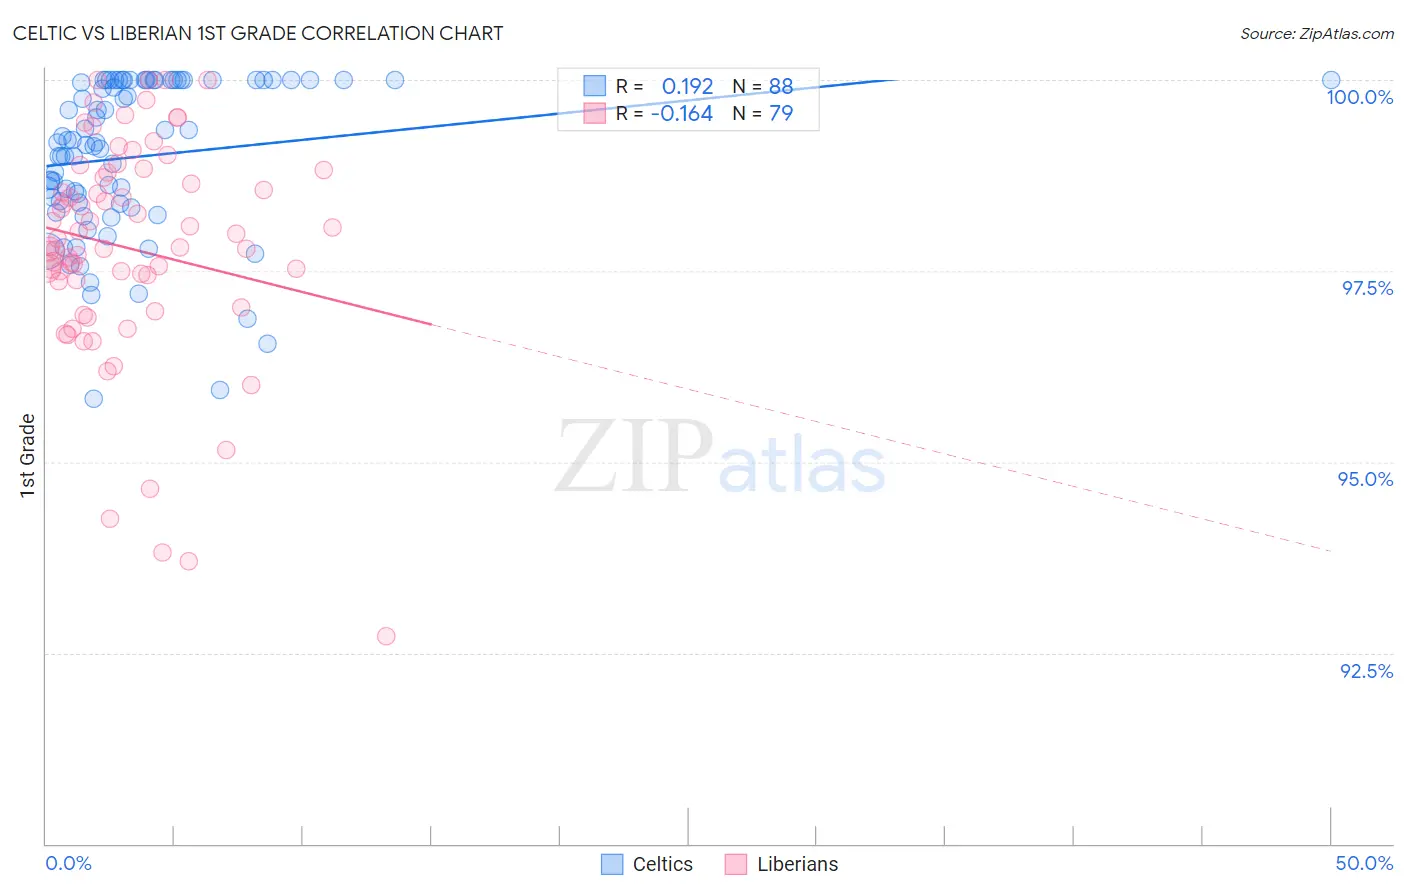
Celtic vs Liberian 1st Grade Correlation Chart
The statistical analysis conducted on geographies consisting of 168,875,705 people shows a poor positive correlation between the proportion of Celtics and percentage of population with at least 1st grade education in the United States with a correlation coefficient (R) of 0.192 and weighted average of 98.4%. Similarly, the statistical analysis conducted on geographies consisting of 118,100,194 people shows a poor negative correlation between the proportion of Liberians and percentage of population with at least 1st grade education in the United States with a correlation coefficient (R) of -0.164 and weighted average of 97.6%, a difference of 0.83%.
1st Grade Correlation Summary
| Measurement | Celtic | Liberian |
| Minimum | 95.8% | 92.7% |
| Maximum | 100.0% | 100.0% |
| Range | 4.2% | 7.3% |
| Mean | 99.0% | 97.8% |
| Median | 99.2% | 97.8% |
| Interquartile 25% (IQ1) | 98.4% | 97.4% |
| Interquartile 75% (IQ3) | 100.0% | 98.8% |
| Interquartile Range (IQR) | 1.6% | 1.4% |
| Standard Deviation (Sample) | 1.0% | 1.5% |
| Standard Deviation (Population) | 1.0% | 1.5% |
Similar Demographics by 1st Grade
Demographics Similar to Celtics by 1st Grade
In terms of 1st grade, the demographic groups most similar to Celtics are White/Caucasian (98.4%, a difference of 0.0%), Estonian (98.4%, a difference of 0.0%), Pueblo (98.4%, a difference of 0.0%), Kiowa (98.4%, a difference of 0.0%), and Ottawa (98.4%, a difference of 0.010%).
| Demographics | Rating | Rank | 1st Grade |
| Native Hawaiians | 99.9 /100 | #42 | Exceptional 98.5% |
| Lumbee | 99.9 /100 | #43 | Exceptional 98.5% |
| Northern Europeans | 99.9 /100 | #44 | Exceptional 98.5% |
| Belgians | 99.9 /100 | #45 | Exceptional 98.4% |
| Hungarians | 99.9 /100 | #46 | Exceptional 98.4% |
| Ottawa | 99.8 /100 | #47 | Exceptional 98.4% |
| Czechoslovakians | 99.8 /100 | #48 | Exceptional 98.4% |
| Celtics | 99.8 /100 | #49 | Exceptional 98.4% |
| Whites/Caucasians | 99.8 /100 | #50 | Exceptional 98.4% |
| Estonians | 99.8 /100 | #51 | Exceptional 98.4% |
| Pueblo | 99.8 /100 | #52 | Exceptional 98.4% |
| Kiowa | 99.8 /100 | #53 | Exceptional 98.4% |
| Australians | 99.8 /100 | #54 | Exceptional 98.4% |
| Immigrants | Scotland | 99.8 /100 | #55 | Exceptional 98.4% |
| Americans | 99.8 /100 | #56 | Exceptional 98.4% |
Demographics Similar to Liberians by 1st Grade
In terms of 1st grade, the demographic groups most similar to Liberians are Korean (97.6%, a difference of 0.0%), Immigrants from Eastern Asia (97.6%, a difference of 0.010%), Immigrants from Indonesia (97.6%, a difference of 0.010%), Bolivian (97.6%, a difference of 0.010%), and U.S. Virgin Islander (97.6%, a difference of 0.020%).
| Demographics | Rating | Rank | 1st Grade |
| Colombians | 2.2 /100 | #234 | Tragic 97.6% |
| Immigrants | Malaysia | 2.1 /100 | #235 | Tragic 97.6% |
| Immigrants | Western Asia | 2.1 /100 | #236 | Tragic 97.6% |
| U.S. Virgin Islanders | 1.9 /100 | #237 | Tragic 97.6% |
| Nigerians | 1.8 /100 | #238 | Tragic 97.6% |
| Immigrants | Eastern Asia | 1.6 /100 | #239 | Tragic 97.6% |
| Koreans | 1.5 /100 | #240 | Tragic 97.6% |
| Liberians | 1.4 /100 | #241 | Tragic 97.6% |
| Immigrants | Indonesia | 1.2 /100 | #242 | Tragic 97.6% |
| Bolivians | 1.2 /100 | #243 | Tragic 97.6% |
| Asians | 1.1 /100 | #244 | Tragic 97.6% |
| South Americans | 1.1 /100 | #245 | Tragic 97.6% |
| Immigrants | Eastern Africa | 1.0 /100 | #246 | Tragic 97.6% |
| Peruvians | 1.0 /100 | #247 | Tragic 97.6% |
| Immigrants | Middle Africa | 1.0 /100 | #248 | Tragic 97.6% |