Immigrants from Sweden vs Brazilian 5th Grade
COMPARE
Immigrants from Sweden
Brazilian
5th Grade
5th Grade Comparison
Immigrants from Sweden
Brazilians
97.8%
5TH GRADE
98.7/ 100
METRIC RATING
92nd/ 347
METRIC RANK
97.2%
5TH GRADE
25.4/ 100
METRIC RATING
197th/ 347
METRIC RANK
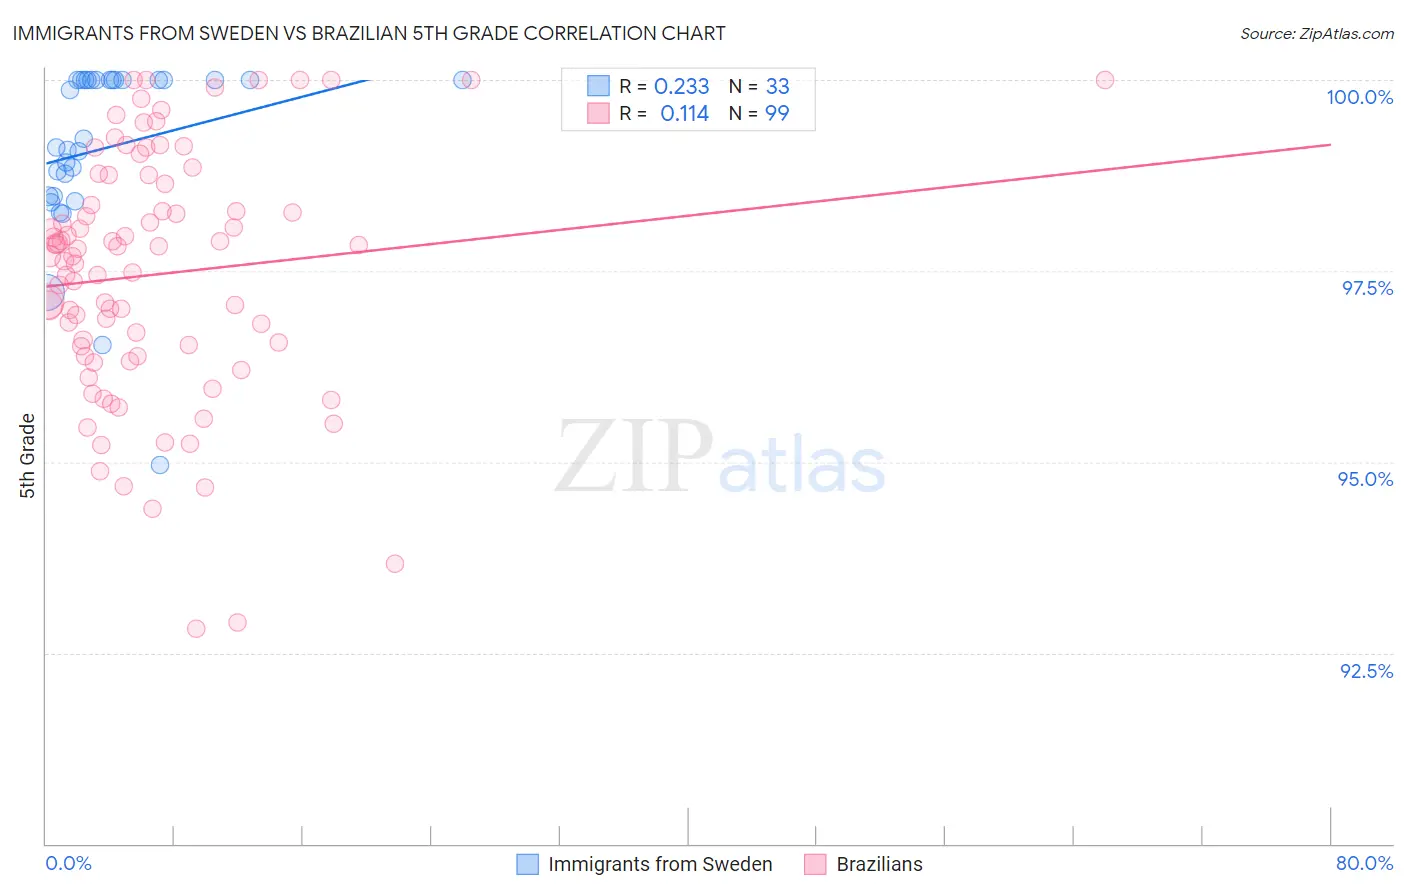
Immigrants from Sweden vs Brazilian 5th Grade Correlation Chart
The statistical analysis conducted on geographies consisting of 164,737,092 people shows a weak positive correlation between the proportion of Immigrants from Sweden and percentage of population with at least 5th grade education in the United States with a correlation coefficient (R) of 0.233 and weighted average of 97.8%. Similarly, the statistical analysis conducted on geographies consisting of 323,962,626 people shows a poor positive correlation between the proportion of Brazilians and percentage of population with at least 5th grade education in the United States with a correlation coefficient (R) of 0.114 and weighted average of 97.2%, a difference of 0.56%.
5th Grade Correlation Summary
| Measurement | Immigrants from Sweden | Brazilian |
| Minimum | 95.0% | 92.8% |
| Maximum | 100.0% | 100.0% |
| Range | 5.0% | 7.2% |
| Mean | 99.1% | 97.5% |
| Median | 99.2% | 97.7% |
| Interquartile 25% (IQ1) | 98.5% | 96.4% |
| Interquartile 75% (IQ3) | 100.0% | 98.6% |
| Interquartile Range (IQR) | 1.5% | 2.3% |
| Standard Deviation (Sample) | 1.2% | 1.6% |
| Standard Deviation (Population) | 1.1% | 1.6% |
Similar Demographics by 5th Grade
Demographics Similar to Immigrants from Sweden by 5th Grade
In terms of 5th grade, the demographic groups most similar to Immigrants from Sweden are Immigrants from Western Europe (97.8%, a difference of 0.0%), Immigrants from Australia (97.8%, a difference of 0.010%), Shoshone (97.8%, a difference of 0.010%), Immigrants from South Africa (97.8%, a difference of 0.010%), and Immigrants from Ireland (97.8%, a difference of 0.010%).
| Demographics | Rating | Rank | 5th Grade |
| Immigrants | Belgium | 99.0 /100 | #85 | Exceptional 97.8% |
| Cypriots | 98.9 /100 | #86 | Exceptional 97.8% |
| Immigrants | Australia | 98.8 /100 | #87 | Exceptional 97.8% |
| Shoshone | 98.8 /100 | #88 | Exceptional 97.8% |
| Immigrants | South Africa | 98.8 /100 | #89 | Exceptional 97.8% |
| Immigrants | Ireland | 98.8 /100 | #90 | Exceptional 97.8% |
| Immigrants | Western Europe | 98.8 /100 | #91 | Exceptional 97.8% |
| Immigrants | Sweden | 98.7 /100 | #92 | Exceptional 97.8% |
| Delaware | 98.6 /100 | #93 | Exceptional 97.8% |
| Immigrants | Denmark | 98.6 /100 | #94 | Exceptional 97.8% |
| Romanians | 98.6 /100 | #95 | Exceptional 97.8% |
| Immigrants | Germany | 98.5 /100 | #96 | Exceptional 97.8% |
| Cree | 98.4 /100 | #97 | Exceptional 97.7% |
| Yugoslavians | 98.3 /100 | #98 | Exceptional 97.7% |
| Turks | 98.3 /100 | #99 | Exceptional 97.7% |
Demographics Similar to Brazilians by 5th Grade
In terms of 5th grade, the demographic groups most similar to Brazilians are Hawaiian (97.2%, a difference of 0.0%), Guamanian/Chamorro (97.2%, a difference of 0.010%), Navajo (97.2%, a difference of 0.020%), Immigrants from Albania (97.2%, a difference of 0.020%), and Black/African American (97.3%, a difference of 0.030%).
| Demographics | Rating | Rank | 5th Grade |
| Blacks/African Americans | 31.8 /100 | #190 | Fair 97.3% |
| Immigrants | Brazil | 31.5 /100 | #191 | Fair 97.3% |
| Panamanians | 31.3 /100 | #192 | Fair 97.3% |
| Navajo | 29.0 /100 | #193 | Fair 97.2% |
| Immigrants | Albania | 28.5 /100 | #194 | Fair 97.2% |
| Guamanians/Chamorros | 26.8 /100 | #195 | Fair 97.2% |
| Hawaiians | 25.6 /100 | #196 | Fair 97.2% |
| Brazilians | 25.4 /100 | #197 | Fair 97.2% |
| Immigrants | Uganda | 21.1 /100 | #198 | Fair 97.2% |
| Natives/Alaskans | 18.0 /100 | #199 | Poor 97.2% |
| Immigrants | Northern Africa | 16.8 /100 | #200 | Poor 97.2% |
| Immigrants | Chile | 16.6 /100 | #201 | Poor 97.2% |
| Africans | 15.3 /100 | #202 | Poor 97.2% |
| Immigrants | Bahamas | 14.9 /100 | #203 | Poor 97.2% |
| Immigrants | Zaire | 13.7 /100 | #204 | Poor 97.1% |