Immigrants from Ghana vs Costa Rican GED/Equivalency
COMPARE
Immigrants from Ghana
Costa Rican
GED/Equivalency
GED/Equivalency Comparison
Immigrants from Ghana
Costa Ricans
83.9%
GED/EQUIVALENCY
1.3/ 100
METRIC RATING
244th/ 347
METRIC RANK
85.2%
GED/EQUIVALENCY
20.4/ 100
METRIC RATING
197th/ 347
METRIC RANK
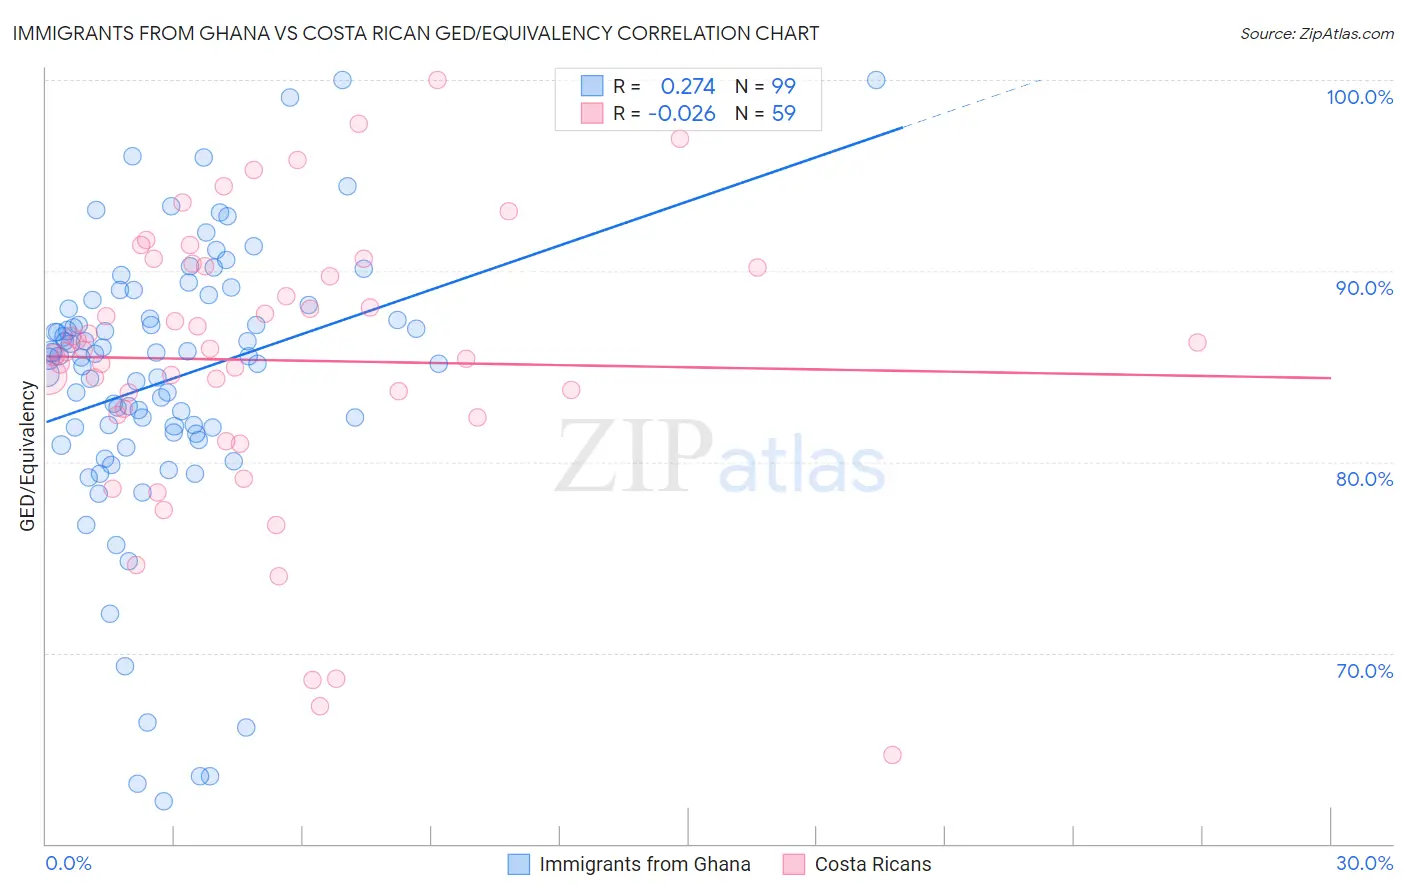
Immigrants from Ghana vs Costa Rican GED/Equivalency Correlation Chart
The statistical analysis conducted on geographies consisting of 199,951,982 people shows a weak positive correlation between the proportion of Immigrants from Ghana and percentage of population with at least ged/equivalency education in the United States with a correlation coefficient (R) of 0.274 and weighted average of 83.9%. Similarly, the statistical analysis conducted on geographies consisting of 253,601,897 people shows no correlation between the proportion of Costa Ricans and percentage of population with at least ged/equivalency education in the United States with a correlation coefficient (R) of -0.026 and weighted average of 85.2%, a difference of 1.5%.
GED/Equivalency Correlation Summary
| Measurement | Immigrants from Ghana | Costa Rican |
| Minimum | 62.2% | 64.7% |
| Maximum | 100.0% | 100.0% |
| Range | 37.8% | 35.3% |
| Mean | 84.3% | 85.3% |
| Median | 85.5% | 85.9% |
| Interquartile 25% (IQ1) | 81.6% | 82.5% |
| Interquartile 75% (IQ3) | 88.2% | 90.3% |
| Interquartile Range (IQR) | 6.7% | 7.8% |
| Standard Deviation (Sample) | 7.4% | 7.3% |
| Standard Deviation (Population) | 7.4% | 7.3% |
Similar Demographics by GED/Equivalency
Demographics Similar to Immigrants from Ghana by GED/Equivalency
In terms of ged/equivalency, the demographic groups most similar to Immigrants from Ghana are Cherokee (83.9%, a difference of 0.010%), Immigrants from Senegal (83.8%, a difference of 0.030%), Chickasaw (83.8%, a difference of 0.050%), Immigrants from Western Africa (83.8%, a difference of 0.090%), and Blackfeet (83.8%, a difference of 0.10%).
| Demographics | Rating | Rank | GED/Equivalency |
| Sub-Saharan Africans | 3.0 /100 | #237 | Tragic 84.2% |
| Immigrants | Peru | 2.7 /100 | #238 | Tragic 84.2% |
| Immigrants | Bahamas | 2.6 /100 | #239 | Tragic 84.2% |
| Immigrants | South Eastern Asia | 2.5 /100 | #240 | Tragic 84.1% |
| Senegalese | 1.9 /100 | #241 | Tragic 84.0% |
| Sri Lankans | 1.9 /100 | #242 | Tragic 84.0% |
| Cherokee | 1.3 /100 | #243 | Tragic 83.9% |
| Immigrants | Ghana | 1.3 /100 | #244 | Tragic 83.9% |
| Immigrants | Senegal | 1.2 /100 | #245 | Tragic 83.8% |
| Chickasaw | 1.2 /100 | #246 | Tragic 83.8% |
| Immigrants | Western Africa | 1.1 /100 | #247 | Tragic 83.8% |
| Blackfeet | 1.1 /100 | #248 | Tragic 83.8% |
| Crow | 1.1 /100 | #249 | Tragic 83.8% |
| Shoshone | 1.0 /100 | #250 | Tragic 83.7% |
| Spanish Americans | 0.8 /100 | #251 | Tragic 83.6% |
Demographics Similar to Costa Ricans by GED/Equivalency
In terms of ged/equivalency, the demographic groups most similar to Costa Ricans are Puget Sound Salish (85.2%, a difference of 0.010%), Chippewa (85.2%, a difference of 0.010%), Tongan (85.2%, a difference of 0.010%), Delaware (85.2%, a difference of 0.060%), and South American Indian (85.2%, a difference of 0.070%).
| Demographics | Rating | Rank | GED/Equivalency |
| Alaskan Athabascans | 27.5 /100 | #190 | Fair 85.3% |
| South American Indians | 22.8 /100 | #191 | Fair 85.2% |
| Immigrants | Nonimmigrants | 22.7 /100 | #192 | Fair 85.2% |
| Delaware | 22.2 /100 | #193 | Fair 85.2% |
| Puget Sound Salish | 20.8 /100 | #194 | Fair 85.2% |
| Chippewa | 20.8 /100 | #195 | Fair 85.2% |
| Tongans | 20.7 /100 | #196 | Fair 85.2% |
| Costa Ricans | 20.4 /100 | #197 | Fair 85.2% |
| Immigrants | Africa | 17.5 /100 | #198 | Poor 85.1% |
| Somalis | 16.4 /100 | #199 | Poor 85.0% |
| Uruguayans | 16.0 /100 | #200 | Poor 85.0% |
| Portuguese | 15.9 /100 | #201 | Poor 85.0% |
| Cree | 15.9 /100 | #202 | Poor 85.0% |
| Panamanians | 15.3 /100 | #203 | Poor 85.0% |
| Hawaiians | 15.2 /100 | #204 | Poor 85.0% |