Immigrants from Germany vs Immigrants from Czechoslovakia Unemployment Among Ages 55 to 59 years

COMPARE

Immigrants from Germany
Race
Ancestry
AfghanAfricanAlaska NativeAlaskan AthabascanAlbanianAleutAlsatianAmericanApacheArabArapahoArgentineanArmenianAssyrian/Chaldean/SyriacAustralianAustrianBahamianBangladeshiBarbadianBasqueBelgianBelizeanBermudanBhutaneseBlackfeetBolivianBrazilianBritishBritish West IndianBulgarianBurmeseCajunCambodianCanadianCape VerdeanCarpatho RusynCelticCentral AmericanCentral American IndianCherokeeCheyenneChickasawChileanChineseChippewaChoctawColombianColvilleComancheCosta RicanCreeCreekCroatianCrowCubanCypriotCzechCzechoslovakianDanishDelawareDominicanDutchDutch West IndianEastern EuropeanEcuadorianEgyptianEnglishEstonianEthiopianEuropeanFijianFilipinoFinnishFrenchFrench American IndianFrench CanadianGermanGerman RussianGhanaianGreekGuamanian/ChamorroGuatemalanGuyaneseHaitianHmongHonduranHopiHoumaHungarianIcelanderIndian (Asian)IndonesianInupiatIranianIraqiIrishIroquoisIsraeliItalianJamaicanJapaneseJordanianKenyanKiowaKoreanLaotianLatvianLebaneseLiberianLithuanianLumbeeLuxembourgerMacedonianMalaysianMalteseMarshalleseMenomineeMexicanMexican American IndianMongolianMoroccanNative HawaiianNavajoNepaleseNew ZealanderNicaraguanNigerianNorthern EuropeanNorwegianOkinawanOsageOttawaPaiutePakistaniPalestinianPanamanianParaguayanPennsylvania GermanPeruvianPimaPolishPortuguesePotawatomiPuebloPuerto RicanPuget Sound SalishRomanianRussianSalvadoranSamoanScandinavianScotch-IrishScottishSeminoleSenegaleseSerbianShoshoneSierra LeoneanSiouxSlavicSlovakSloveneSomaliSouth AfricanSouth AmericanSouth American IndianSoviet UnionSpaniardSpanishSpanish AmericanSpanish American IndianSri LankanSubsaharan AfricanSudaneseSwedishSwissSyrianTaiwaneseThaiTlingit-HaidaTohono O'OdhamTonganTrinidadian and TobagonianTsimshianTurkishU.S. Virgin IslanderUgandanUkrainianUruguayanUteVenezuelanVietnameseWelshWest IndianYakamaYaquiYugoslavianYumanYup'ikZimbabwean
Immigration
NonimmigrantsImmigrantsAfghanistanAfricaAlbaniaArgentinaArmeniaAsiaAustraliaAustriaBahamasBangladeshBarbadosBelarusBelgiumBelizeBoliviaBosnia and HerzegovinaBrazilBulgariaBurma/MyanmarCabo VerdeCambodiaCameroonCanadaCaribbeanCentral AmericaChileChinaColombiaCongoCosta RicaCroatiaCubaDenmarkDominicaDominican RepublicEastern AfricaEastern AsiaEastern EuropeEcuadorEgyptEl SalvadorEnglandEritreaEthiopiaEuropeFijiFranceGermanyGhanaGreeceGrenadaGuatemalaGuyanaHaitiHondurasHong KongHungaryIndiaIndonesiaIranIraqIrelandIsraelItalyJamaicaJapanJordanKazakhstanKenyaKoreaKuwaitLaosLatin AmericaLatviaLebanonLiberiaLithuaniaMalaysiaMexicoMicronesiaMiddle AfricaMoldovaMoroccoNepalNetherlandsNicaraguaNigeriaNorth AmericaNorth MacedoniaNorthern AfricaNorthern EuropeNorwayOceaniaPakistanPanamaPeruPhilippinesPolandPortugalRomaniaRussiaSaudi ArabiaScotlandSenegalSerbiaSierra LeoneSingaporeSomaliaSouth AfricaSouth AmericaSouth Central AsiaSouth Eastern AsiaSouthern EuropeSpainSri LankaSt. Vincent and the GrenadinesSudanSwedenSwitzerlandSyriaTaiwanThailandTrinidad and TobagoTurkeyUgandaUkraineUruguayUzbekistanVenezuelaVietnamWest IndiesWestern AfricaWestern AsiaWestern EuropeYemenZaireZimbabweAzores
Immigrants from Czechoslovakia
Race
Ancestry
AfghanAfricanAlaska NativeAlaskan AthabascanAlbanianAleutAlsatianAmericanApacheArabArapahoArgentineanArmenianAssyrian/Chaldean/SyriacAustralianAustrianBahamianBangladeshiBarbadianBasqueBelgianBelizeanBermudanBhutaneseBlackfeetBolivianBrazilianBritishBritish West IndianBulgarianBurmeseCajunCambodianCanadianCape VerdeanCarpatho RusynCelticCentral AmericanCentral American IndianCherokeeCheyenneChickasawChileanChineseChippewaChoctawColombianColvilleComancheCosta RicanCreeCreekCroatianCrowCubanCypriotCzechCzechoslovakianDanishDelawareDominicanDutchDutch West IndianEastern EuropeanEcuadorianEgyptianEnglishEstonianEthiopianEuropeanFijianFilipinoFinnishFrenchFrench American IndianFrench CanadianGermanGerman RussianGhanaianGreekGuamanian/ChamorroGuatemalanGuyaneseHaitianHmongHonduranHopiHoumaHungarianIcelanderIndian (Asian)IndonesianInupiatIranianIraqiIrishIroquoisIsraeliItalianJamaicanJapaneseJordanianKenyanKiowaKoreanLaotianLatvianLebaneseLiberianLithuanianLumbeeLuxembourgerMacedonianMalaysianMalteseMarshalleseMenomineeMexicanMexican American IndianMongolianMoroccanNative HawaiianNavajoNepaleseNew ZealanderNicaraguanNigerianNorthern EuropeanNorwegianOkinawanOsageOttawaPaiutePakistaniPalestinianPanamanianParaguayanPennsylvania GermanPeruvianPimaPolishPortuguesePotawatomiPuebloPuerto RicanPuget Sound SalishRomanianRussianSalvadoranSamoanScandinavianScotch-IrishScottishSeminoleSenegaleseSerbianShoshoneSierra LeoneanSiouxSlavicSlovakSloveneSomaliSouth AfricanSouth AmericanSouth American IndianSoviet UnionSpaniardSpanishSpanish AmericanSpanish American IndianSri LankanSubsaharan AfricanSudaneseSwedishSwissSyrianTaiwaneseThaiTlingit-HaidaTohono O'OdhamTonganTrinidadian and TobagonianTsimshianTurkishU.S. Virgin IslanderUgandanUkrainianUruguayanUteVenezuelanVietnameseWelshWest IndianYakamaYaquiYugoslavianYumanYup'ikZimbabwean
Immigration
NonimmigrantsImmigrantsAfghanistanAfricaAlbaniaArgentinaArmeniaAsiaAustraliaAustriaBahamasBangladeshBarbadosBelarusBelgiumBelizeBoliviaBosnia and HerzegovinaBrazilBulgariaBurma/MyanmarCabo VerdeCambodiaCameroonCanadaCaribbeanCentral AmericaChileChinaColombiaCongoCosta RicaCroatiaCubaCzechoslovakiaDenmarkDominicaDominican RepublicEastern AfricaEastern AsiaEastern EuropeEcuadorEgyptEl SalvadorEnglandEritreaEthiopiaEuropeFijiFranceGhanaGreeceGrenadaGuatemalaGuyanaHaitiHondurasHong KongHungaryIndiaIndonesiaIranIraqIrelandIsraelItalyJamaicaJapanJordanKazakhstanKenyaKoreaKuwaitLaosLatin AmericaLatviaLebanonLiberiaLithuaniaMalaysiaMexicoMicronesiaMiddle AfricaMoldovaMoroccoNepalNetherlandsNicaraguaNigeriaNorth AmericaNorth MacedoniaNorthern AfricaNorthern EuropeNorwayOceaniaPakistanPanamaPeruPhilippinesPolandPortugalRomaniaRussiaSaudi ArabiaScotlandSenegalSerbiaSierra LeoneSingaporeSomaliaSouth AfricaSouth AmericaSouth Central AsiaSouth Eastern AsiaSouthern EuropeSpainSri LankaSt. Vincent and the GrenadinesSudanSwedenSwitzerlandSyriaTaiwanThailandTrinidad and TobagoTurkeyUgandaUkraineUruguayUzbekistanVenezuelaVietnamWest IndiesWestern AfricaWestern AsiaWestern EuropeYemenZaireZimbabweAzores
Unemployment Among Ages 55 to 59 years
Income
Poverty
Unemployment
Labor Participation
Family Structure
Vehicle Availability
Education Level
Disability

Unemployment Among Ages 55 to 59 years Comparison

Immigrants from Germany

Immigrants from Czechoslovakia

Exceptional
Fair
4.7%
UNEMPLOYMENT AMONG AGES 55 TO 59 YEARS
94.8/ 100
METRIC RATING
98th/ 347
METRIC RANK
4.8%
UNEMPLOYMENT AMONG AGES 55 TO 59 YEARS
38.0/ 100
METRIC RATING
184th/ 347
METRIC RANK

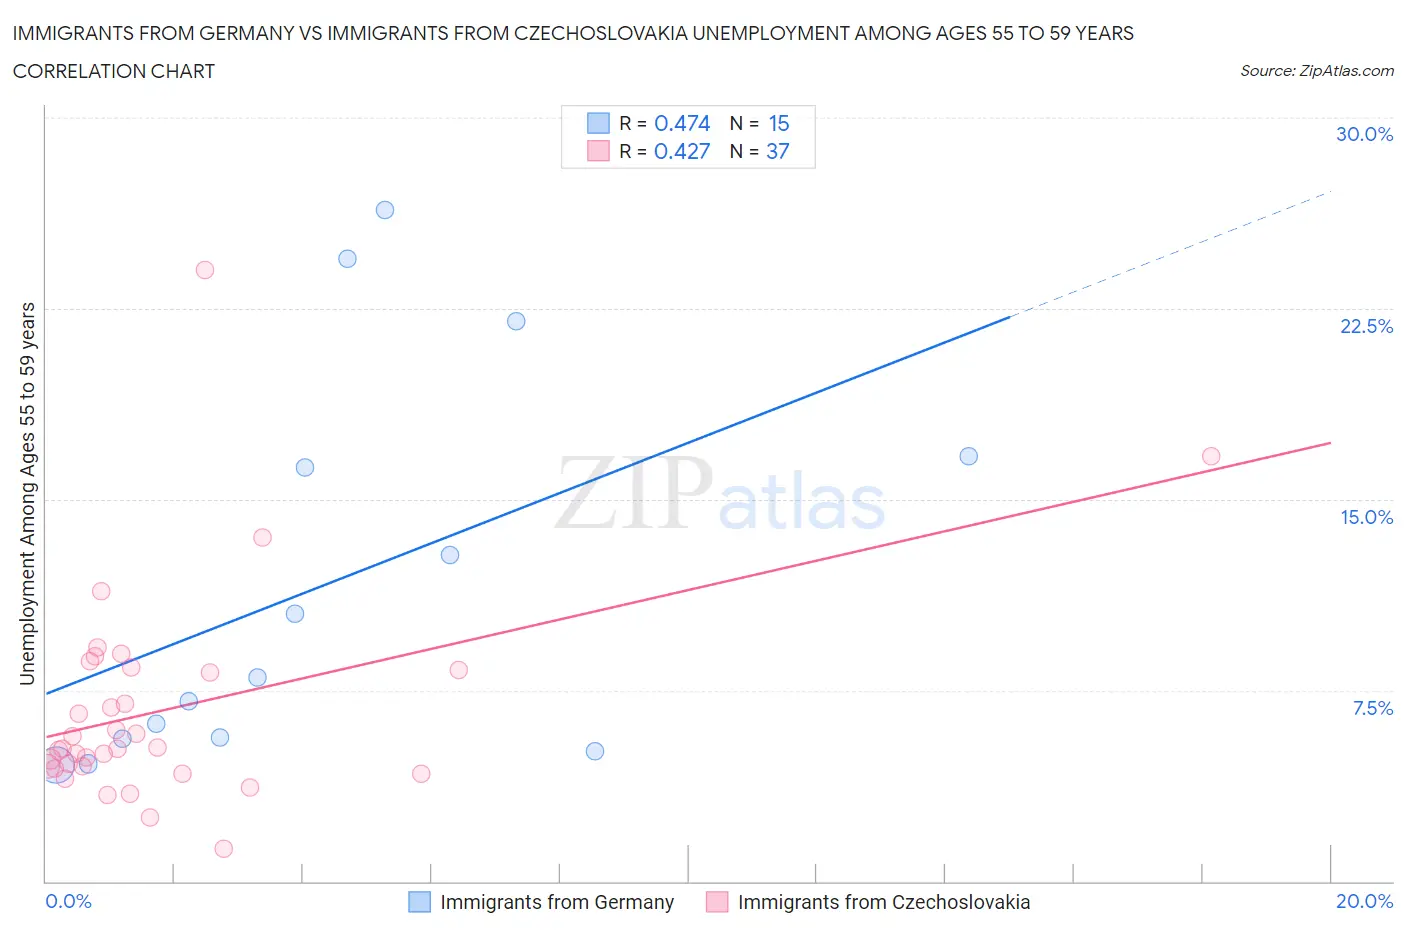
Immigrants from Germany vs Immigrants from Czechoslovakia Unemployment Among Ages 55 to 59 years Correlation Chart

The statistical analysis conducted on geographies consisting of 421,964,428 people shows a moderate positive correlation between the proportion of Immigrants from Germany and unemployment rate among population between the ages 55 and 59 in the United States with a correlation coefficient (R) of 0.474 and weighted average of 4.7%. Similarly, the statistical analysis conducted on geographies consisting of 189,282,601 people shows a moderate positive correlation between the proportion of Immigrants from Czechoslovakia and unemployment rate among population between the ages 55 and 59 in the United States with a correlation coefficient (R) of 0.427 and weighted average of 4.8%, a difference of 3.6%.
Immigrants from Germany vs Immigrants from Czechoslovakia Unemployment Among Ages 55 to 59 years

Unemployment Among Ages 55 to 59 years Correlation Summary

MeasurementImmigrants from GermanyImmigrants from Czechoslovakia
Minimum4.6%1.3%
Maximum26.4%24.0%
Range21.8%22.7%
Mean11.7%6.7%
Median8.0%5.2%
Interquartile 25% (IQ1)5.6%4.5%
Interquartile 75% (IQ3)16.7%8.3%
Interquartile Range (IQR)11.1%3.9%
Standard Deviation (Sample)7.6%4.2%
Standard Deviation (Population)7.4%4.1%

Similar Demographics by Unemployment Among Ages 55 to 59 years

Demographics Similar to Immigrants from Germany by Unemployment Among Ages 55 to 59 years

In terms of unemployment among ages 55 to 59 years, the demographic groups most similar to Immigrants from Germany are Immigrants from Canada (4.7%, a difference of 0.010%), Yugoslavian (4.7%, a difference of 0.020%), Immigrants from Belgium (4.7%, a difference of 0.030%), Serbian (4.7%, a difference of 0.090%), and Celtic (4.7%, a difference of 0.11%).
DemographicsRating | RankUnemployment Among Ages 55 to 59 years
New Zealanders
96.3
/100
|
#91
Exceptional
4.7%
Iraqis
96.1
/100
|
#92
Exceptional
4.7%
Immigrants | England
95.8
/100
|
#93
Exceptional
4.7%
Immigrants | Scotland
95.7
/100
|
#94
Exceptional
4.7%
South Africans
95.6
/100
|
#95
Exceptional
4.7%
Immigrants | Belgium
95.0
/100
|
#96
Exceptional
4.7%
Immigrants | Canada
94.9
/100
|
#97
Exceptional
4.7%
Immigrants | Germany
94.8
/100
|
#98
Exceptional
4.7%
Yugoslavians
94.7
/100
|
#99
Exceptional
4.7%
Serbians
94.4
/100
|
#100
Exceptional
4.7%
Celtics
94.3
/100
|
#101
Exceptional
4.7%
Canadians
94.1
/100
|
#102
Exceptional
4.7%
Immigrants | Oceania
94.0
/100
|
#103
Exceptional
4.7%
Immigrants | Turkey
93.9
/100
|
#104
Exceptional
4.7%
Immigrants | North America
93.9
/100
|
#105
Exceptional
4.7%

Demographics Similar to Immigrants from Czechoslovakia by Unemployment Among Ages 55 to 59 years

In terms of unemployment among ages 55 to 59 years, the demographic groups most similar to Immigrants from Czechoslovakia are Immigrants from Peru (4.8%, a difference of 0.020%), Peruvian (4.8%, a difference of 0.040%), Osage (4.8%, a difference of 0.040%), Immigrants from Morocco (4.8%, a difference of 0.070%), and Immigrants from Eastern Asia (4.8%, a difference of 0.090%).
DemographicsRating | RankUnemployment Among Ages 55 to 59 years
Immigrants | Sri Lanka
46.8
/100
|
#177
Average
4.8%
Arabs
44.7
/100
|
#178
Average
4.8%
Hungarians
44.3
/100
|
#179
Average
4.8%
South Americans
44.0
/100
|
#180
Average
4.8%
Immigrants | Hungary
40.4
/100
|
#181
Average
4.8%
Immigrants | Europe
40.4
/100
|
#182
Average
4.8%
Immigrants | Peru
38.6
/100
|
#183
Fair
4.8%
Immigrants | Czechoslovakia
38.0
/100
|
#184
Fair
4.8%
Peruvians
37.0
/100
|
#185
Fair
4.8%
Osage
37.0
/100
|
#186
Fair
4.8%
Immigrants | Morocco
36.5
/100
|
#187
Fair
4.8%
Immigrants | Eastern Asia
36.1
/100
|
#188
Fair
4.8%
Iroquois
34.5
/100
|
#189
Fair
4.9%
Russians
33.9
/100
|
#190
Fair
4.9%
Iranians
32.4
/100
|
#191
Fair
4.9%