Immigrants from Germany vs Cape Verdean 3rd Grade
COMPARE
Immigrants from Germany
Cape Verdean
3rd Grade
3rd Grade Comparison
Immigrants from Germany
Cape Verdeans
98.1%
3RD GRADE
98.4/ 100
METRIC RATING
94th/ 347
METRIC RANK
96.6%
3RD GRADE
0.0/ 100
METRIC RATING
310th/ 347
METRIC RANK
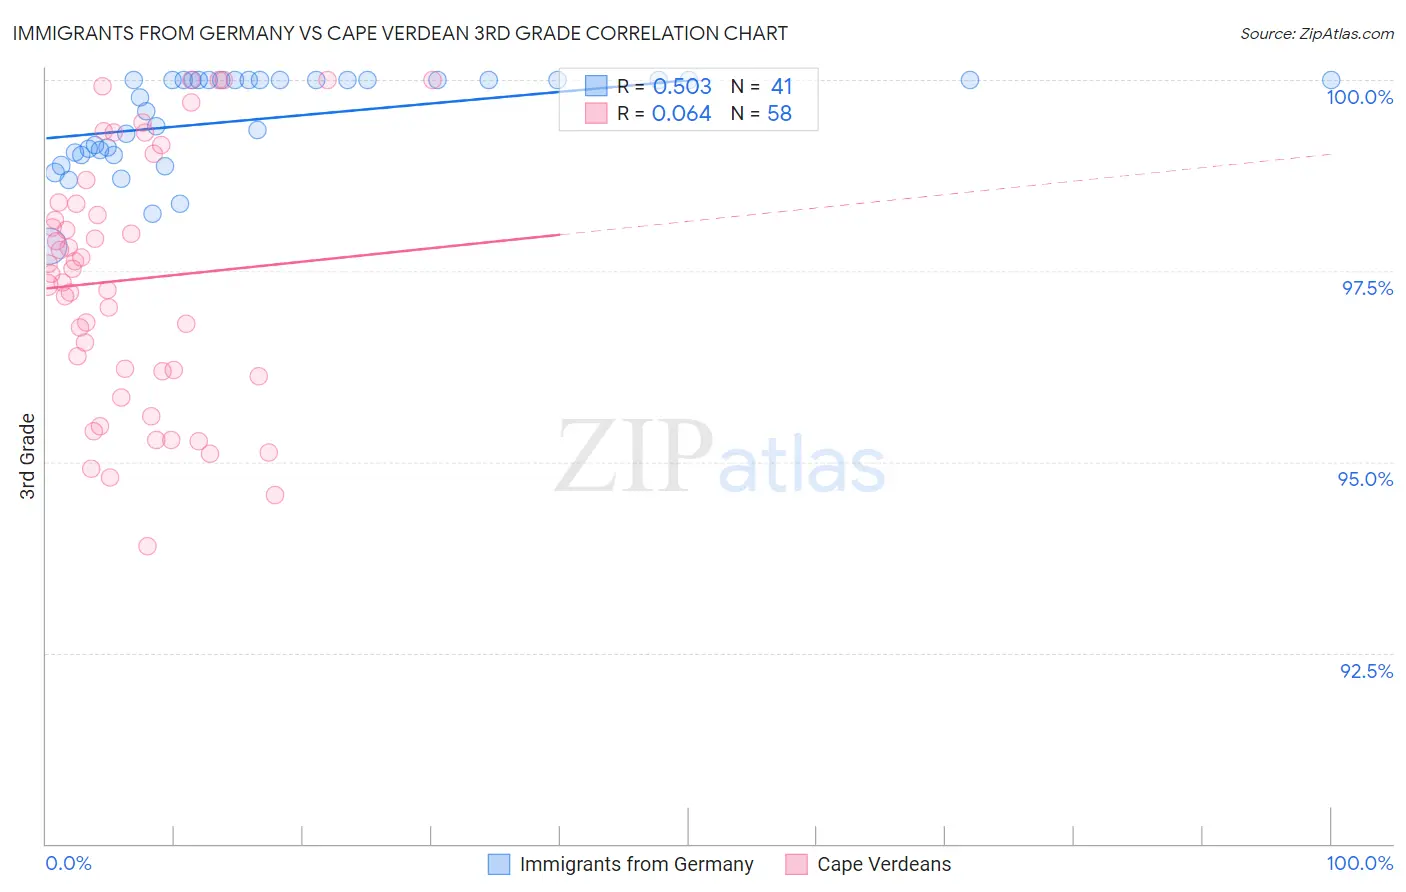
Immigrants from Germany vs Cape Verdean 3rd Grade Correlation Chart
The statistical analysis conducted on geographies consisting of 463,886,643 people shows a substantial positive correlation between the proportion of Immigrants from Germany and percentage of population with at least 3rd grade education in the United States with a correlation coefficient (R) of 0.503 and weighted average of 98.1%. Similarly, the statistical analysis conducted on geographies consisting of 107,537,955 people shows a slight positive correlation between the proportion of Cape Verdeans and percentage of population with at least 3rd grade education in the United States with a correlation coefficient (R) of 0.064 and weighted average of 96.6%, a difference of 1.5%.
3rd Grade Correlation Summary
| Measurement | Immigrants from Germany | Cape Verdean |
| Minimum | 97.8% | 93.9% |
| Maximum | 100.0% | 100.0% |
| Range | 2.2% | 6.1% |
| Mean | 99.5% | 97.4% |
| Median | 100.0% | 97.5% |
| Interquartile 25% (IQ1) | 99.0% | 96.2% |
| Interquartile 75% (IQ3) | 100.0% | 98.4% |
| Interquartile Range (IQR) | 0.96% | 2.2% |
| Standard Deviation (Sample) | 0.61% | 1.6% |
| Standard Deviation (Population) | 0.60% | 1.6% |
Similar Demographics by 3rd Grade
Demographics Similar to Immigrants from Germany by 3rd Grade
In terms of 3rd grade, the demographic groups most similar to Immigrants from Germany are Cypriot (98.1%, a difference of 0.0%), Immigrants from Ireland (98.1%, a difference of 0.010%), South African (98.1%, a difference of 0.010%), Delaware (98.1%, a difference of 0.020%), and Zimbabwean (98.1%, a difference of 0.020%).
| Demographics | Rating | Rank | 3rd Grade |
| Immigrants | Denmark | 98.8 /100 | #87 | Exceptional 98.1% |
| Immigrants | India | 98.8 /100 | #88 | Exceptional 98.1% |
| Delaware | 98.8 /100 | #89 | Exceptional 98.1% |
| Zimbabweans | 98.8 /100 | #90 | Exceptional 98.1% |
| Hopi | 98.7 /100 | #91 | Exceptional 98.1% |
| Immigrants | South Africa | 98.7 /100 | #92 | Exceptional 98.1% |
| Immigrants | Western Europe | 98.7 /100 | #93 | Exceptional 98.1% |
| Immigrants | Germany | 98.4 /100 | #94 | Exceptional 98.1% |
| Cypriots | 98.4 /100 | #95 | Exceptional 98.1% |
| Immigrants | Ireland | 98.2 /100 | #96 | Exceptional 98.1% |
| South Africans | 98.2 /100 | #97 | Exceptional 98.1% |
| Choctaw | 98.0 /100 | #98 | Exceptional 98.1% |
| Romanians | 98.0 /100 | #99 | Exceptional 98.1% |
| Cree | 97.9 /100 | #100 | Exceptional 98.1% |
| Puget Sound Salish | 97.9 /100 | #101 | Exceptional 98.1% |
Demographics Similar to Cape Verdeans by 3rd Grade
In terms of 3rd grade, the demographic groups most similar to Cape Verdeans are Nicaraguan (96.7%, a difference of 0.030%), Immigrants from Haiti (96.7%, a difference of 0.030%), Sri Lankan (96.7%, a difference of 0.030%), Immigrants from Guyana (96.6%, a difference of 0.030%), and Immigrants from Laos (96.6%, a difference of 0.040%).
| Demographics | Rating | Rank | 3rd Grade |
| Ecuadorians | 0.0 /100 | #303 | Tragic 96.7% |
| Immigrants | Caribbean | 0.0 /100 | #304 | Tragic 96.7% |
| Central American Indians | 0.0 /100 | #305 | Tragic 96.7% |
| Guyanese | 0.0 /100 | #306 | Tragic 96.7% |
| Nicaraguans | 0.0 /100 | #307 | Tragic 96.7% |
| Immigrants | Haiti | 0.0 /100 | #308 | Tragic 96.7% |
| Sri Lankans | 0.0 /100 | #309 | Tragic 96.7% |
| Cape Verdeans | 0.0 /100 | #310 | Tragic 96.6% |
| Immigrants | Guyana | 0.0 /100 | #311 | Tragic 96.6% |
| Immigrants | Laos | 0.0 /100 | #312 | Tragic 96.6% |
| Immigrants | Ecuador | 0.0 /100 | #313 | Tragic 96.6% |
| Belizeans | 0.0 /100 | #314 | Tragic 96.6% |
| Immigrants | Azores | 0.0 /100 | #315 | Tragic 96.6% |
| Immigrants | Burma/Myanmar | 0.0 /100 | #316 | Tragic 96.6% |
| Immigrants | Bangladesh | 0.0 /100 | #317 | Tragic 96.6% |