Immigrants from France vs European 5th Grade
COMPARE
Immigrants from France
European
5th Grade
5th Grade Comparison
Immigrants from France
Europeans
97.6%
5TH GRADE
94.8/ 100
METRIC RATING
121st/ 347
METRIC RANK
98.2%
5TH GRADE
100.0/ 100
METRIC RATING
31st/ 347
METRIC RANK
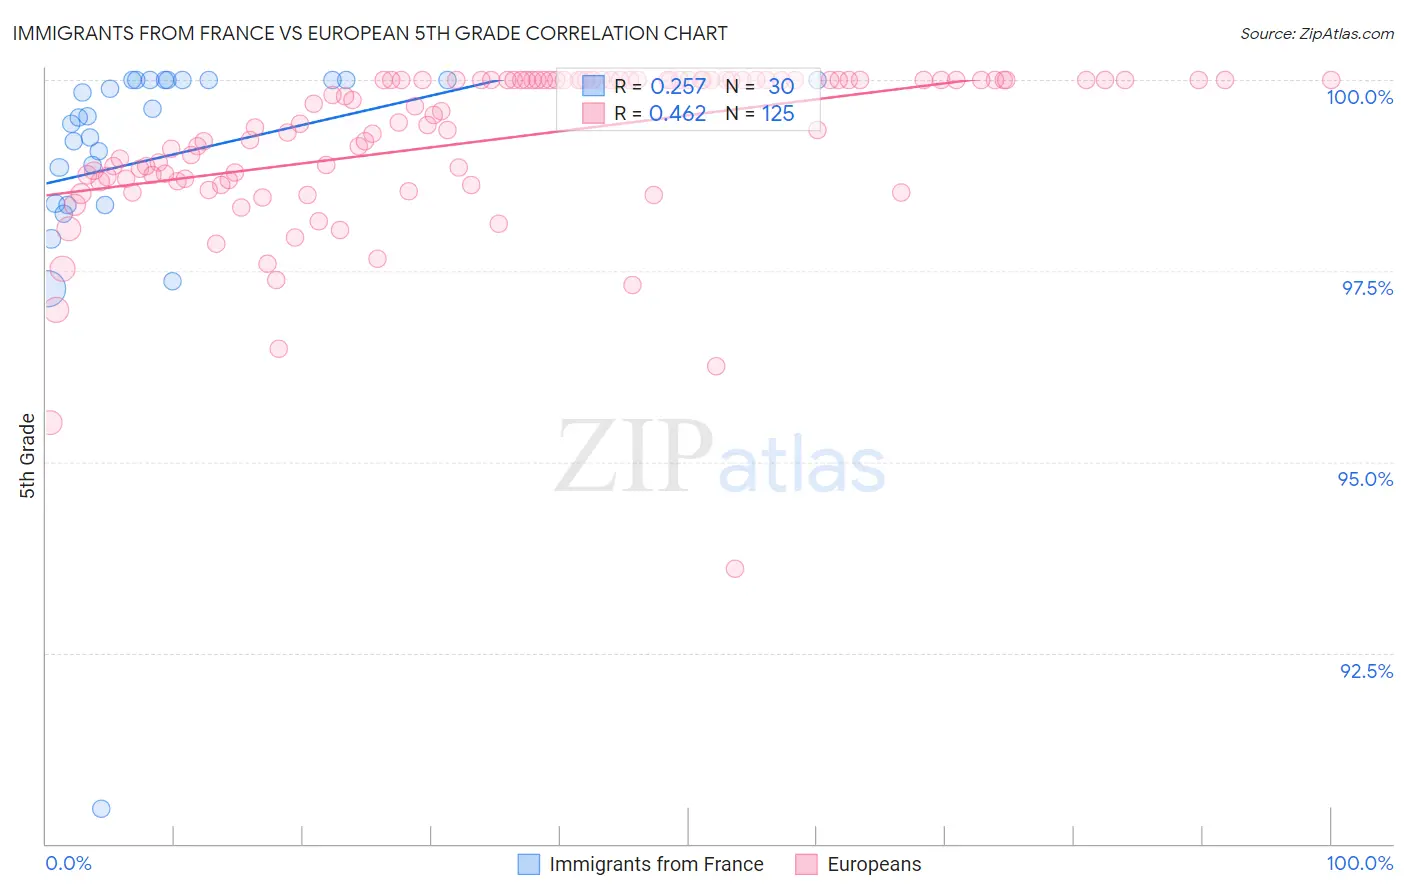
Immigrants from France vs European 5th Grade Correlation Chart
The statistical analysis conducted on geographies consisting of 287,920,814 people shows a weak positive correlation between the proportion of Immigrants from France and percentage of population with at least 5th grade education in the United States with a correlation coefficient (R) of 0.257 and weighted average of 97.6%. Similarly, the statistical analysis conducted on geographies consisting of 561,829,544 people shows a moderate positive correlation between the proportion of Europeans and percentage of population with at least 5th grade education in the United States with a correlation coefficient (R) of 0.462 and weighted average of 98.2%, a difference of 0.56%.
5th Grade Correlation Summary
| Measurement | Immigrants from France | European |
| Minimum | 90.5% | 93.6% |
| Maximum | 100.0% | 100.0% |
| Range | 9.5% | 6.4% |
| Mean | 99.0% | 99.2% |
| Median | 99.5% | 99.6% |
| Interquartile 25% (IQ1) | 98.4% | 98.7% |
| Interquartile 75% (IQ3) | 100.0% | 100.0% |
| Interquartile Range (IQR) | 1.6% | 1.3% |
| Standard Deviation (Sample) | 1.8% | 1.0% |
| Standard Deviation (Population) | 1.8% | 1.0% |
Similar Demographics by 5th Grade
Demographics Similar to Immigrants from France by 5th Grade
In terms of 5th grade, the demographic groups most similar to Immigrants from France are Immigrants from Zimbabwe (97.6%, a difference of 0.0%), Immigrants from Japan (97.6%, a difference of 0.0%), Immigrants from Norway (97.6%, a difference of 0.0%), Immigrants from Saudi Arabia (97.6%, a difference of 0.010%), and Basque (97.6%, a difference of 0.010%).
| Demographics | Rating | Rank | 5th Grade |
| Lebanese | 95.7 /100 | #114 | Exceptional 97.6% |
| Okinawans | 95.7 /100 | #115 | Exceptional 97.6% |
| Immigrants | Croatia | 95.5 /100 | #116 | Exceptional 97.6% |
| Immigrants | Saudi Arabia | 95.4 /100 | #117 | Exceptional 97.6% |
| Basques | 95.2 /100 | #118 | Exceptional 97.6% |
| Syrians | 95.1 /100 | #119 | Exceptional 97.6% |
| Immigrants | Zimbabwe | 94.9 /100 | #120 | Exceptional 97.6% |
| Immigrants | France | 94.8 /100 | #121 | Exceptional 97.6% |
| Immigrants | Japan | 94.7 /100 | #122 | Exceptional 97.6% |
| Immigrants | Norway | 94.6 /100 | #123 | Exceptional 97.6% |
| Spanish | 93.7 /100 | #124 | Exceptional 97.6% |
| Immigrants | Bulgaria | 93.1 /100 | #125 | Exceptional 97.6% |
| Hmong | 92.3 /100 | #126 | Exceptional 97.6% |
| Immigrants | Serbia | 92.3 /100 | #127 | Exceptional 97.6% |
| Colville | 92.0 /100 | #128 | Exceptional 97.6% |
Demographics Similar to Europeans by 5th Grade
In terms of 5th grade, the demographic groups most similar to Europeans are French Canadian (98.2%, a difference of 0.0%), French (98.2%, a difference of 0.010%), Czech (98.2%, a difference of 0.010%), Scandinavian (98.2%, a difference of 0.010%), and Alaska Native (98.2%, a difference of 0.020%).
| Demographics | Rating | Rank | 5th Grade |
| Scotch-Irish | 100.0 /100 | #24 | Exceptional 98.2% |
| Yup'ik | 100.0 /100 | #25 | Exceptional 98.2% |
| Alaska Natives | 100.0 /100 | #26 | Exceptional 98.2% |
| French | 100.0 /100 | #27 | Exceptional 98.2% |
| Czechs | 100.0 /100 | #28 | Exceptional 98.2% |
| Scandinavians | 100.0 /100 | #29 | Exceptional 98.2% |
| French Canadians | 100.0 /100 | #30 | Exceptional 98.2% |
| Europeans | 100.0 /100 | #31 | Exceptional 98.2% |
| Chippewa | 100.0 /100 | #32 | Exceptional 98.1% |
| Swiss | 100.0 /100 | #33 | Exceptional 98.1% |
| Chinese | 100.0 /100 | #34 | Exceptional 98.1% |
| Italians | 100.0 /100 | #35 | Exceptional 98.1% |
| British | 100.0 /100 | #36 | Exceptional 98.1% |
| Latvians | 99.9 /100 | #37 | Exceptional 98.1% |
| Belgians | 99.9 /100 | #38 | Exceptional 98.1% |