Immigrants from Fiji vs Immigrants from Caribbean 6th Grade
COMPARE
Immigrants from Fiji
Immigrants from Caribbean
6th Grade
6th Grade Comparison
Immigrants from Fiji
Immigrants from Caribbean
95.2%
6TH GRADE
0.0/ 100
METRIC RATING
321st/ 347
METRIC RANK
95.6%
6TH GRADE
0.0/ 100
METRIC RATING
308th/ 347
METRIC RANK
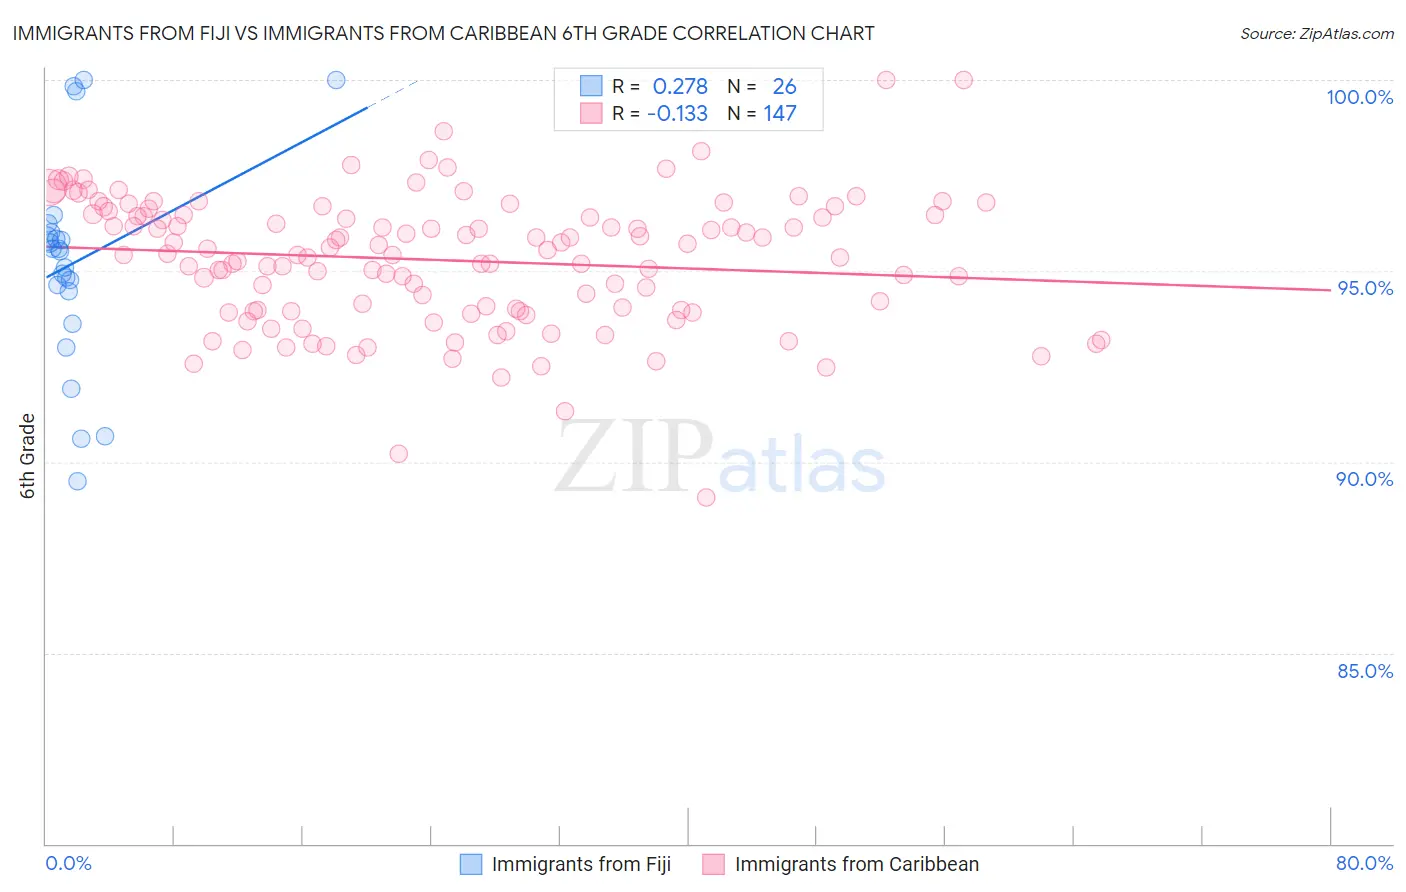
Immigrants from Fiji vs Immigrants from Caribbean 6th Grade Correlation Chart
The statistical analysis conducted on geographies consisting of 93,756,204 people shows a weak positive correlation between the proportion of Immigrants from Fiji and percentage of population with at least 6th grade education in the United States with a correlation coefficient (R) of 0.278 and weighted average of 95.2%. Similarly, the statistical analysis conducted on geographies consisting of 450,022,650 people shows a poor negative correlation between the proportion of Immigrants from Caribbean and percentage of population with at least 6th grade education in the United States with a correlation coefficient (R) of -0.133 and weighted average of 95.6%, a difference of 0.37%.
6th Grade Correlation Summary
| Measurement | Immigrants from Fiji | Immigrants from Caribbean |
| Minimum | 89.5% | 89.1% |
| Maximum | 100.0% | 100.0% |
| Range | 10.5% | 10.9% |
| Mean | 95.2% | 95.3% |
| Median | 95.5% | 95.4% |
| Interquartile 25% (IQ1) | 94.5% | 94.0% |
| Interquartile 75% (IQ3) | 96.0% | 96.5% |
| Interquartile Range (IQR) | 1.6% | 2.5% |
| Standard Deviation (Sample) | 2.7% | 1.7% |
| Standard Deviation (Population) | 2.7% | 1.7% |
Demographics Similar to Immigrants from Fiji and Immigrants from Caribbean by 6th Grade
In terms of 6th grade, the demographic groups most similar to Immigrants from Fiji are Immigrants from Cambodia (95.2%, a difference of 0.050%), Immigrants from Ecuador (95.3%, a difference of 0.060%), Central American Indian (95.1%, a difference of 0.060%), Cape Verdean (95.1%, a difference of 0.090%), and Immigrants from Belize (95.3%, a difference of 0.10%). Similarly, the demographic groups most similar to Immigrants from Caribbean are Guyanese (95.6%, a difference of 0.010%), Immigrants from Haiti (95.6%, a difference of 0.030%), Puerto Rican (95.5%, a difference of 0.050%), Ecuadorian (95.5%, a difference of 0.060%), and Immigrants from Cuba (95.6%, a difference of 0.070%).
| Demographics | Rating | Rank | 6th Grade |
| Indonesians | 0.0 /100 | #304 | Tragic 95.6% |
| Immigrants | Cuba | 0.0 /100 | #305 | Tragic 95.6% |
| Immigrants | Haiti | 0.0 /100 | #306 | Tragic 95.6% |
| Guyanese | 0.0 /100 | #307 | Tragic 95.6% |
| Immigrants | Caribbean | 0.0 /100 | #308 | Tragic 95.6% |
| Puerto Ricans | 0.0 /100 | #309 | Tragic 95.5% |
| Ecuadorians | 0.0 /100 | #310 | Tragic 95.5% |
| Immigrants | Portugal | 0.0 /100 | #311 | Tragic 95.5% |
| Immigrants | Guyana | 0.0 /100 | #312 | Tragic 95.5% |
| Nicaraguans | 0.0 /100 | #313 | Tragic 95.4% |
| Immigrants | Vietnam | 0.0 /100 | #314 | Tragic 95.4% |
| Immigrants | Bangladesh | 0.0 /100 | #315 | Tragic 95.4% |
| Japanese | 0.0 /100 | #316 | Tragic 95.4% |
| Vietnamese | 0.0 /100 | #317 | Tragic 95.3% |
| Belizeans | 0.0 /100 | #318 | Tragic 95.3% |
| Immigrants | Belize | 0.0 /100 | #319 | Tragic 95.3% |
| Immigrants | Ecuador | 0.0 /100 | #320 | Tragic 95.3% |
| Immigrants | Fiji | 0.0 /100 | #321 | Tragic 95.2% |
| Immigrants | Cambodia | 0.0 /100 | #322 | Tragic 95.2% |
| Central American Indians | 0.0 /100 | #323 | Tragic 95.1% |
| Cape Verdeans | 0.0 /100 | #324 | Tragic 95.1% |