Immigrants from France vs Czech 2nd Grade
COMPARE
Immigrants from France
Czech
2nd Grade
2nd Grade Comparison
Immigrants from France
Czechs
98.1%
2ND GRADE
95.6/ 100
METRIC RATING
118th/ 347
METRIC RANK
98.5%
2ND GRADE
100.0/ 100
METRIC RATING
31st/ 347
METRIC RANK
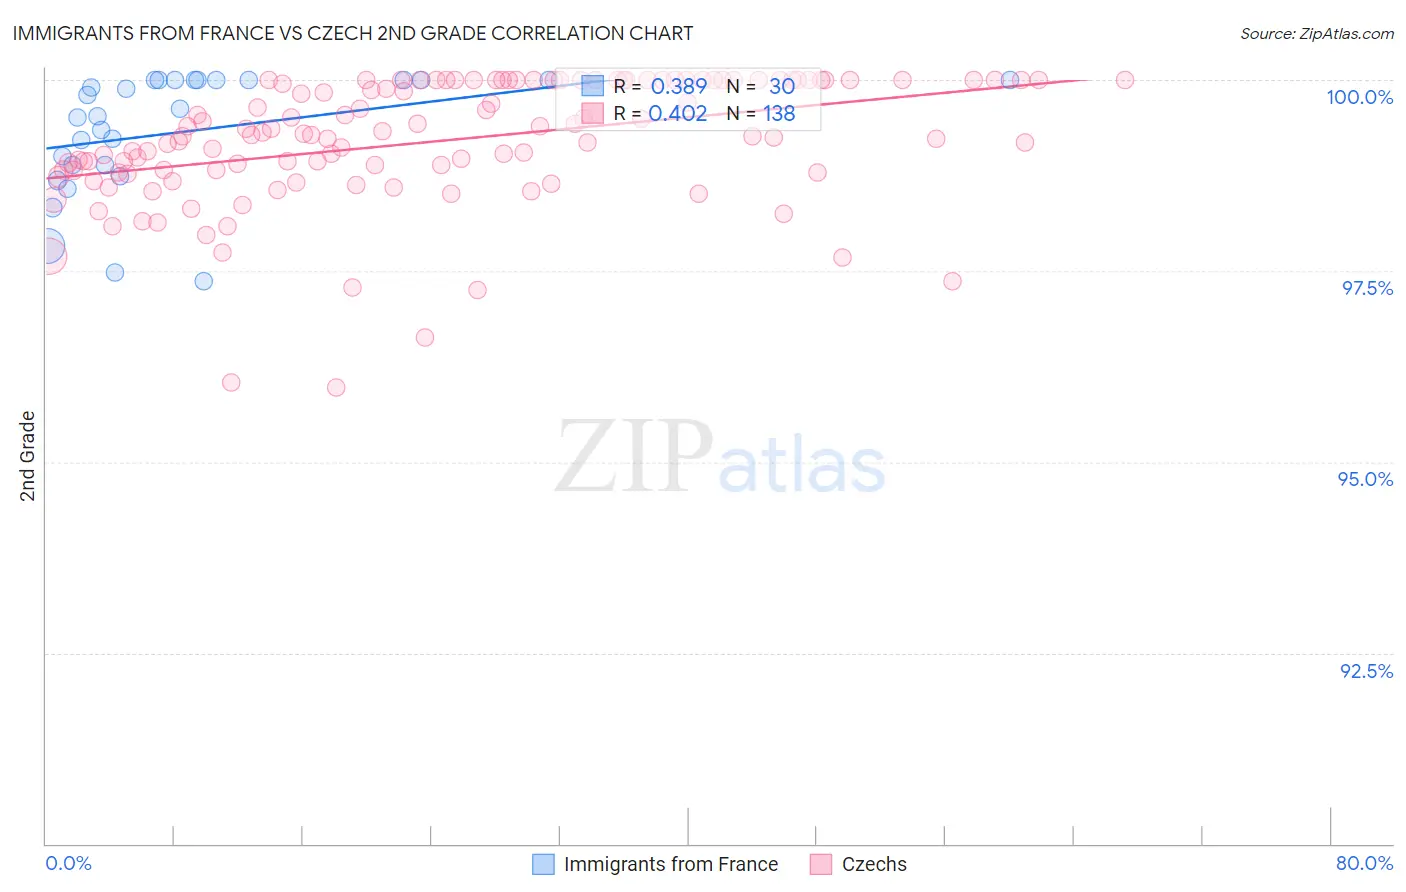
Immigrants from France vs Czech 2nd Grade Correlation Chart
The statistical analysis conducted on geographies consisting of 287,920,814 people shows a mild positive correlation between the proportion of Immigrants from France and percentage of population with at least 2nd grade education in the United States with a correlation coefficient (R) of 0.389 and weighted average of 98.1%. Similarly, the statistical analysis conducted on geographies consisting of 484,813,102 people shows a moderate positive correlation between the proportion of Czechs and percentage of population with at least 2nd grade education in the United States with a correlation coefficient (R) of 0.402 and weighted average of 98.5%, a difference of 0.41%.
2nd Grade Correlation Summary
| Measurement | Immigrants from France | Czech |
| Minimum | 97.4% | 96.0% |
| Maximum | 100.0% | 100.0% |
| Range | 2.6% | 4.0% |
| Mean | 99.3% | 99.2% |
| Median | 99.6% | 99.3% |
| Interquartile 25% (IQ1) | 98.9% | 98.8% |
| Interquartile 75% (IQ3) | 100.0% | 100.0% |
| Interquartile Range (IQR) | 1.1% | 1.2% |
| Standard Deviation (Sample) | 0.80% | 0.82% |
| Standard Deviation (Population) | 0.78% | 0.82% |
Similar Demographics by 2nd Grade
Demographics Similar to Immigrants from France by 2nd Grade
In terms of 2nd grade, the demographic groups most similar to Immigrants from France are Spanish (98.1%, a difference of 0.0%), Ute (98.1%, a difference of 0.0%), Iranian (98.1%, a difference of 0.010%), Thai (98.1%, a difference of 0.010%), and Okinawan (98.1%, a difference of 0.010%).
| Demographics | Rating | Rank | 2nd Grade |
| Immigrants | Czechoslovakia | 96.9 /100 | #111 | Exceptional 98.1% |
| Colville | 96.6 /100 | #112 | Exceptional 98.1% |
| Immigrants | Norway | 96.5 /100 | #113 | Exceptional 98.1% |
| Immigrants | Latvia | 96.4 /100 | #114 | Exceptional 98.1% |
| Iranians | 95.9 /100 | #115 | Exceptional 98.1% |
| Spanish | 95.8 /100 | #116 | Exceptional 98.1% |
| Ute | 95.7 /100 | #117 | Exceptional 98.1% |
| Immigrants | France | 95.6 /100 | #118 | Exceptional 98.1% |
| Thais | 95.3 /100 | #119 | Exceptional 98.1% |
| Okinawans | 94.9 /100 | #120 | Exceptional 98.1% |
| Immigrants | Zimbabwe | 94.4 /100 | #121 | Exceptional 98.1% |
| Lebanese | 94.2 /100 | #122 | Exceptional 98.1% |
| Immigrants | Japan | 94.1 /100 | #123 | Exceptional 98.1% |
| Menominee | 94.1 /100 | #124 | Exceptional 98.1% |
| Iroquois | 94.1 /100 | #125 | Exceptional 98.1% |
Demographics Similar to Czechs by 2nd Grade
In terms of 2nd grade, the demographic groups most similar to Czechs are European (98.5%, a difference of 0.0%), French Canadian (98.5%, a difference of 0.0%), Arapaho (98.5%, a difference of 0.010%), French (98.5%, a difference of 0.010%), and Scandinavian (98.5%, a difference of 0.010%).
| Demographics | Rating | Rank | 2nd Grade |
| Pennsylvania Germans | 100.0 /100 | #24 | Exceptional 98.5% |
| Scotch-Irish | 100.0 /100 | #25 | Exceptional 98.5% |
| Welsh | 100.0 /100 | #26 | Exceptional 98.5% |
| Croatians | 100.0 /100 | #27 | Exceptional 98.5% |
| Arapaho | 100.0 /100 | #28 | Exceptional 98.5% |
| French | 100.0 /100 | #29 | Exceptional 98.5% |
| Europeans | 100.0 /100 | #30 | Exceptional 98.5% |
| Czechs | 100.0 /100 | #31 | Exceptional 98.5% |
| French Canadians | 100.0 /100 | #32 | Exceptional 98.5% |
| Scandinavians | 100.0 /100 | #33 | Exceptional 98.5% |
| Chinese | 100.0 /100 | #34 | Exceptional 98.5% |
| Swiss | 100.0 /100 | #35 | Exceptional 98.5% |
| British | 100.0 /100 | #36 | Exceptional 98.5% |
| Italians | 99.9 /100 | #37 | Exceptional 98.4% |
| Latvians | 99.9 /100 | #38 | Exceptional 98.4% |