Immigrants from Europe vs Immigrants from Belgium Associate's Degree
COMPARE
Immigrants from Europe
Immigrants from Belgium
Associate's Degree
Associate's Degree Comparison
Immigrants from Europe
Immigrants from Belgium
51.3%
ASSOCIATE'S DEGREE
99.7/ 100
METRIC RATING
66th/ 347
METRIC RANK
54.5%
ASSOCIATE'S DEGREE
100.0/ 100
METRIC RATING
26th/ 347
METRIC RANK
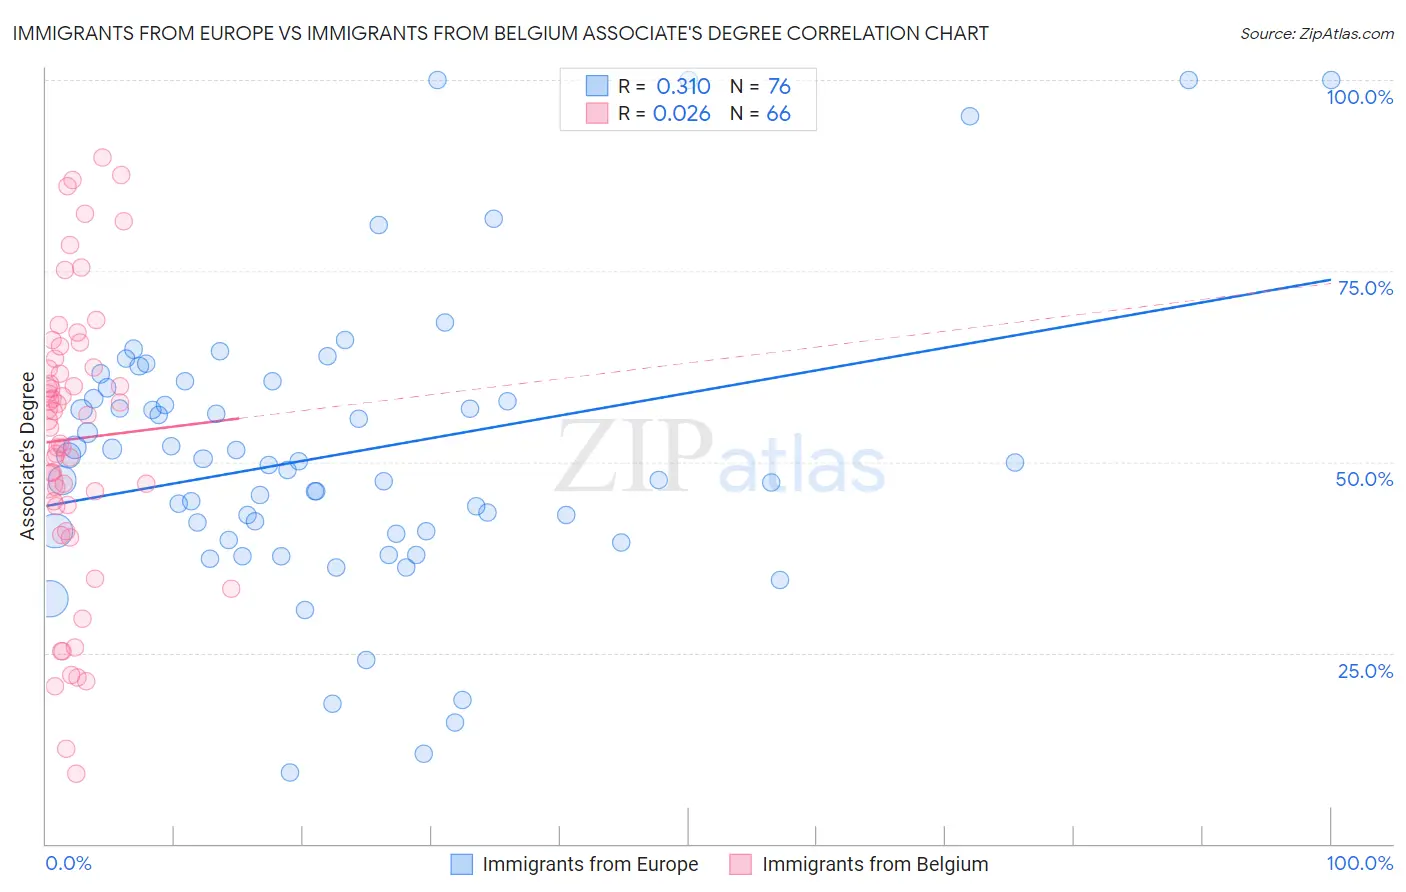
Immigrants from Europe vs Immigrants from Belgium Associate's Degree Correlation Chart
The statistical analysis conducted on geographies consisting of 547,360,790 people shows a mild positive correlation between the proportion of Immigrants from Europe and percentage of population with at least associate's degree education in the United States with a correlation coefficient (R) of 0.310 and weighted average of 51.3%. Similarly, the statistical analysis conducted on geographies consisting of 146,728,237 people shows no correlation between the proportion of Immigrants from Belgium and percentage of population with at least associate's degree education in the United States with a correlation coefficient (R) of 0.026 and weighted average of 54.5%, a difference of 6.2%.
Associate's Degree Correlation Summary
| Measurement | Immigrants from Europe | Immigrants from Belgium |
| Minimum | 9.3% | 9.1% |
| Maximum | 100.0% | 89.8% |
| Range | 90.7% | 80.7% |
| Mean | 51.1% | 53.0% |
| Median | 49.8% | 55.8% |
| Interquartile 25% (IQ1) | 40.8% | 44.3% |
| Interquartile 75% (IQ3) | 59.0% | 62.3% |
| Interquartile Range (IQR) | 18.2% | 18.0% |
| Standard Deviation (Sample) | 18.8% | 18.4% |
| Standard Deviation (Population) | 18.7% | 18.3% |
Similar Demographics by Associate's Degree
Demographics Similar to Immigrants from Europe by Associate's Degree
In terms of associate's degree, the demographic groups most similar to Immigrants from Europe are Zimbabwean (51.3%, a difference of 0.050%), Immigrants from Netherlands (51.4%, a difference of 0.080%), Argentinean (51.2%, a difference of 0.13%), South African (51.4%, a difference of 0.16%), and Immigrants from Kazakhstan (51.4%, a difference of 0.21%).
| Demographics | Rating | Rank | Associate's Degree |
| Immigrants | Serbia | 99.8 /100 | #59 | Exceptional 51.7% |
| Immigrants | Bolivia | 99.7 /100 | #60 | Exceptional 51.5% |
| Immigrants | Kazakhstan | 99.7 /100 | #61 | Exceptional 51.4% |
| Bhutanese | 99.7 /100 | #62 | Exceptional 51.4% |
| South Africans | 99.7 /100 | #63 | Exceptional 51.4% |
| Immigrants | Netherlands | 99.7 /100 | #64 | Exceptional 51.4% |
| Zimbabweans | 99.7 /100 | #65 | Exceptional 51.3% |
| Immigrants | Europe | 99.7 /100 | #66 | Exceptional 51.3% |
| Argentineans | 99.6 /100 | #67 | Exceptional 51.2% |
| Immigrants | Indonesia | 99.5 /100 | #68 | Exceptional 51.0% |
| Egyptians | 99.5 /100 | #69 | Exceptional 50.9% |
| Immigrants | Argentina | 99.5 /100 | #70 | Exceptional 50.9% |
| Immigrants | Romania | 99.5 /100 | #71 | Exceptional 50.9% |
| Immigrants | Pakistan | 99.5 /100 | #72 | Exceptional 50.9% |
| Carpatho Rusyns | 99.3 /100 | #73 | Exceptional 50.6% |
Demographics Similar to Immigrants from Belgium by Associate's Degree
In terms of associate's degree, the demographic groups most similar to Immigrants from Belgium are Immigrants from Switzerland (54.5%, a difference of 0.030%), Immigrants from Korea (54.5%, a difference of 0.070%), Immigrants from Japan (54.6%, a difference of 0.15%), Burmese (54.6%, a difference of 0.15%), and Immigrants from Sweden (54.6%, a difference of 0.19%).
| Demographics | Rating | Rank | Associate's Degree |
| Immigrants | Ireland | 100.0 /100 | #19 | Exceptional 54.7% |
| Cambodians | 100.0 /100 | #20 | Exceptional 54.6% |
| Immigrants | Sweden | 100.0 /100 | #21 | Exceptional 54.6% |
| Immigrants | Japan | 100.0 /100 | #22 | Exceptional 54.6% |
| Burmese | 100.0 /100 | #23 | Exceptional 54.6% |
| Immigrants | Korea | 100.0 /100 | #24 | Exceptional 54.5% |
| Immigrants | Switzerland | 100.0 /100 | #25 | Exceptional 54.5% |
| Immigrants | Belgium | 100.0 /100 | #26 | Exceptional 54.5% |
| Latvians | 100.0 /100 | #27 | Exceptional 53.9% |
| Turks | 100.0 /100 | #28 | Exceptional 53.9% |
| Immigrants | France | 100.0 /100 | #29 | Exceptional 53.9% |
| Immigrants | Sri Lanka | 100.0 /100 | #30 | Exceptional 53.7% |
| Immigrants | Northern Europe | 100.0 /100 | #31 | Exceptional 53.5% |
| Immigrants | Turkey | 100.0 /100 | #32 | Exceptional 53.4% |
| Israelis | 100.0 /100 | #33 | Exceptional 53.4% |