Immigrants from Europe vs Immigrants from Japan 9th Grade
COMPARE
Immigrants from Europe
Immigrants from Japan
9th Grade
9th Grade Comparison
Immigrants from Europe
Immigrants from Japan
95.4%
9TH GRADE
95.7/ 100
METRIC RATING
116th/ 347
METRIC RANK
95.6%
9TH GRADE
98.4/ 100
METRIC RATING
98th/ 347
METRIC RANK
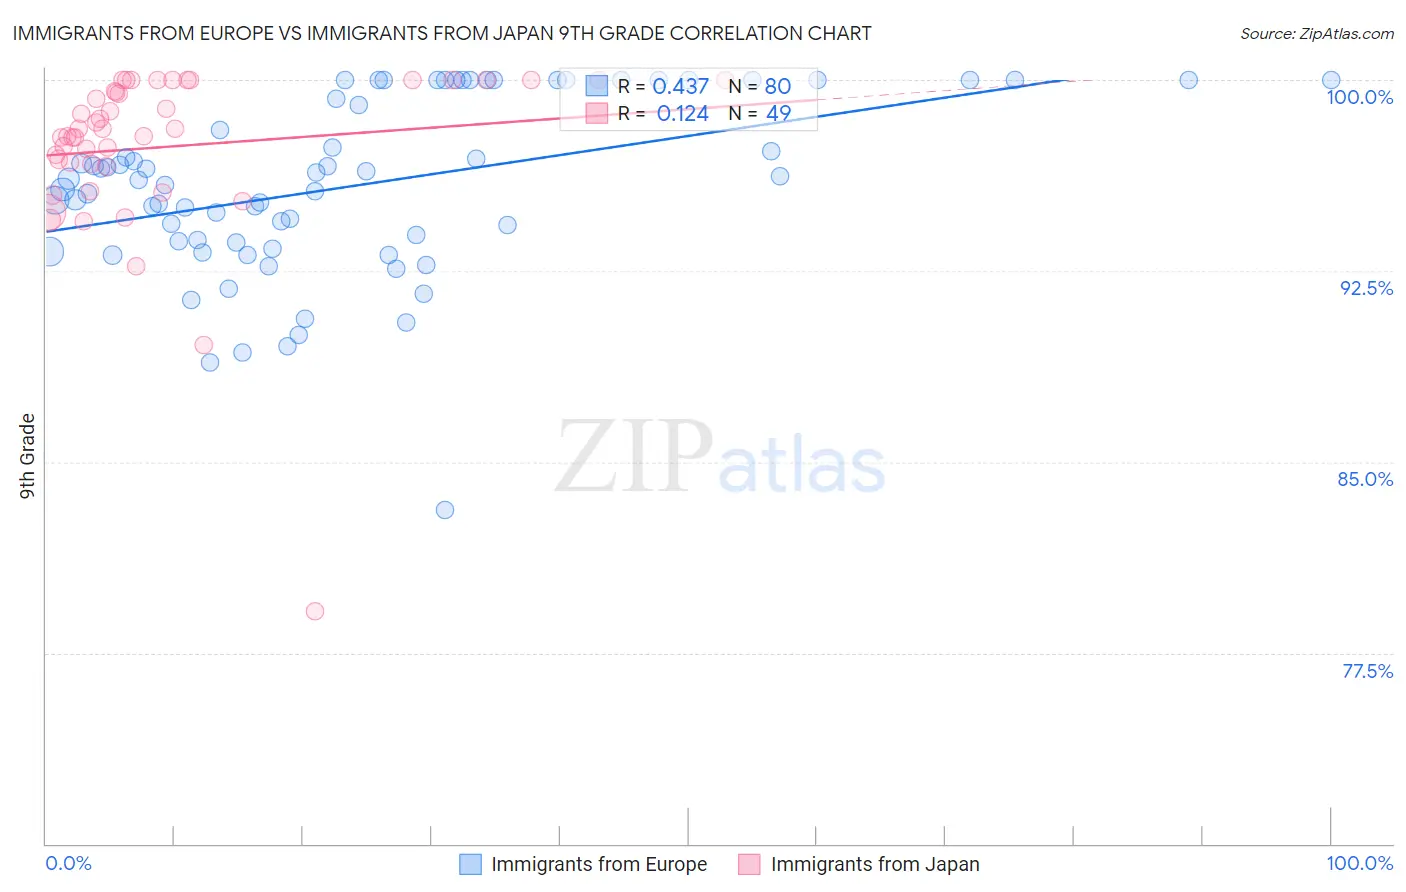
Immigrants from Europe vs Immigrants from Japan 9th Grade Correlation Chart
The statistical analysis conducted on geographies consisting of 547,425,973 people shows a moderate positive correlation between the proportion of Immigrants from Europe and percentage of population with at least 9th grade education in the United States with a correlation coefficient (R) of 0.437 and weighted average of 95.4%. Similarly, the statistical analysis conducted on geographies consisting of 340,148,942 people shows a poor positive correlation between the proportion of Immigrants from Japan and percentage of population with at least 9th grade education in the United States with a correlation coefficient (R) of 0.124 and weighted average of 95.6%, a difference of 0.18%.
9th Grade Correlation Summary
| Measurement | Immigrants from Europe | Immigrants from Japan |
| Minimum | 83.1% | 79.1% |
| Maximum | 100.0% | 100.0% |
| Range | 16.9% | 20.9% |
| Mean | 95.9% | 97.4% |
| Median | 96.1% | 98.1% |
| Interquartile 25% (IQ1) | 93.6% | 96.7% |
| Interquartile 75% (IQ3) | 100.0% | 100.0% |
| Interquartile Range (IQR) | 6.4% | 3.3% |
| Standard Deviation (Sample) | 3.5% | 3.5% |
| Standard Deviation (Population) | 3.4% | 3.4% |
Demographics Similar to Immigrants from Europe and Immigrants from Japan by 9th Grade
In terms of 9th grade, the demographic groups most similar to Immigrants from Europe are Immigrants from Romania (95.4%, a difference of 0.0%), Burmese (95.4%, a difference of 0.010%), Immigrants from Croatia (95.4%, a difference of 0.020%), Iroquois (95.4%, a difference of 0.020%), and German Russian (95.4%, a difference of 0.020%). Similarly, the demographic groups most similar to Immigrants from Japan are Menominee (95.6%, a difference of 0.0%), Delaware (95.6%, a difference of 0.010%), Lebanese (95.6%, a difference of 0.020%), Immigrants from Moldova (95.5%, a difference of 0.050%), and Immigrants from Switzerland (95.5%, a difference of 0.060%).
| Demographics | Rating | Rank | 9th Grade |
| Delaware | 98.4 /100 | #97 | Exceptional 95.6% |
| Immigrants | Japan | 98.4 /100 | #98 | Exceptional 95.6% |
| Menominee | 98.3 /100 | #99 | Exceptional 95.6% |
| Lebanese | 98.1 /100 | #100 | Exceptional 95.6% |
| Immigrants | Moldova | 97.9 /100 | #101 | Exceptional 95.5% |
| Immigrants | Switzerland | 97.7 /100 | #102 | Exceptional 95.5% |
| Potawatomi | 97.7 /100 | #103 | Exceptional 95.5% |
| Syrians | 97.4 /100 | #104 | Exceptional 95.5% |
| Immigrants | France | 97.4 /100 | #105 | Exceptional 95.5% |
| Immigrants | Norway | 97.1 /100 | #106 | Exceptional 95.5% |
| Immigrants | Zimbabwe | 96.9 /100 | #107 | Exceptional 95.5% |
| Chickasaw | 96.8 /100 | #108 | Exceptional 95.5% |
| Osage | 96.8 /100 | #109 | Exceptional 95.5% |
| Immigrants | Bulgaria | 96.7 /100 | #110 | Exceptional 95.5% |
| Cherokee | 96.3 /100 | #111 | Exceptional 95.4% |
| Immigrants | Croatia | 96.2 /100 | #112 | Exceptional 95.4% |
| Iroquois | 96.2 /100 | #113 | Exceptional 95.4% |
| German Russians | 96.1 /100 | #114 | Exceptional 95.4% |
| Burmese | 96.0 /100 | #115 | Exceptional 95.4% |
| Immigrants | Europe | 95.7 /100 | #116 | Exceptional 95.4% |
| Immigrants | Romania | 95.6 /100 | #117 | Exceptional 95.4% |