Immigrants from Northern Europe vs Immigrants from Japan 9th Grade
COMPARE
Immigrants from Northern Europe
Immigrants from Japan
9th Grade
9th Grade Comparison
Immigrants from Northern Europe
Immigrants from Japan
96.0%
9TH GRADE
99.9/ 100
METRIC RATING
51st/ 347
METRIC RANK
95.6%
9TH GRADE
98.4/ 100
METRIC RATING
98th/ 347
METRIC RANK
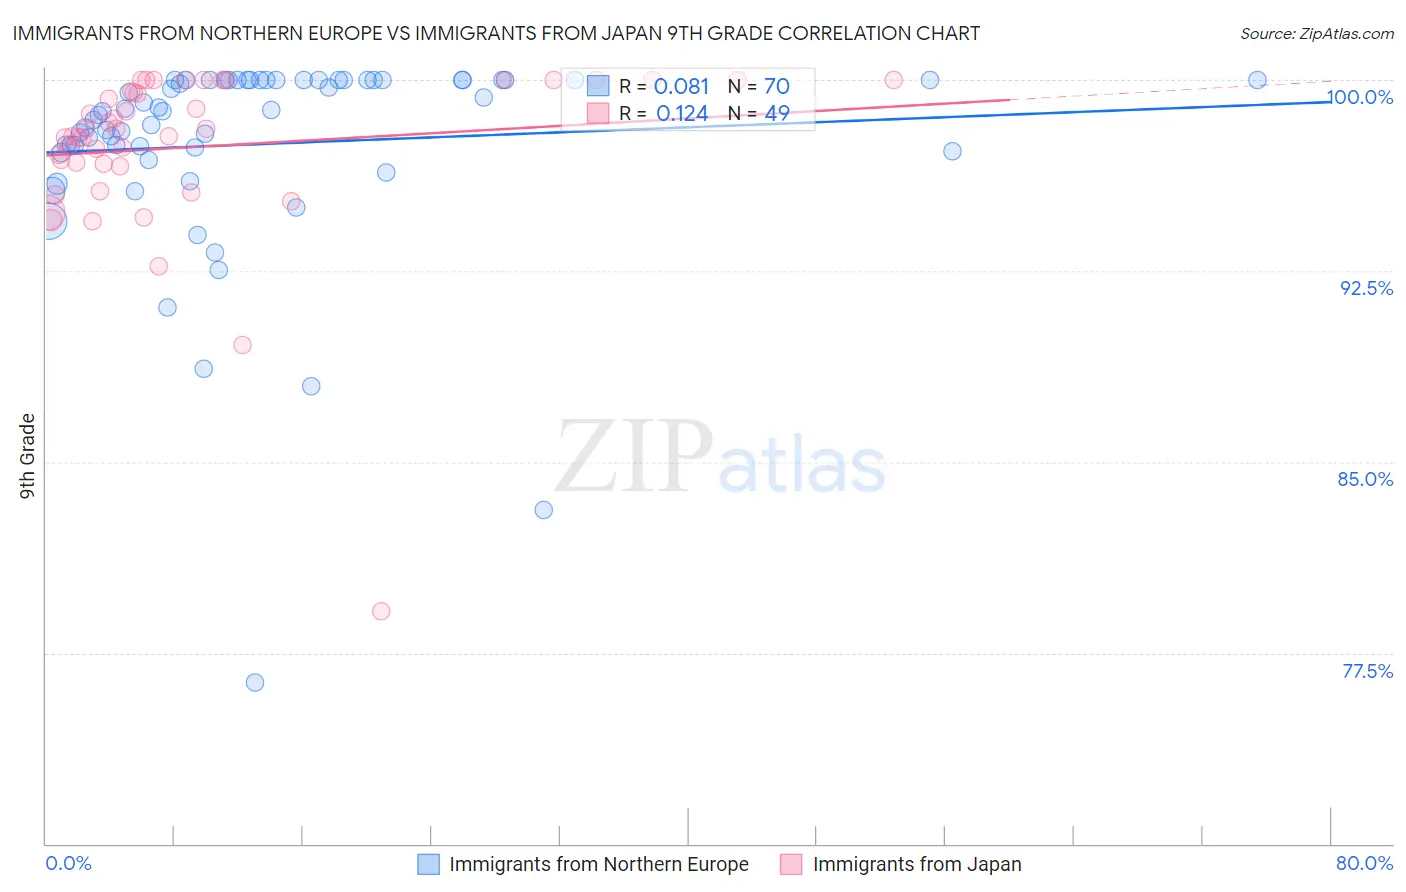
Immigrants from Northern Europe vs Immigrants from Japan 9th Grade Correlation Chart
The statistical analysis conducted on geographies consisting of 477,226,871 people shows a slight positive correlation between the proportion of Immigrants from Northern Europe and percentage of population with at least 9th grade education in the United States with a correlation coefficient (R) of 0.081 and weighted average of 96.0%. Similarly, the statistical analysis conducted on geographies consisting of 340,148,942 people shows a poor positive correlation between the proportion of Immigrants from Japan and percentage of population with at least 9th grade education in the United States with a correlation coefficient (R) of 0.124 and weighted average of 95.6%, a difference of 0.45%.
9th Grade Correlation Summary
| Measurement | Immigrants from Northern Europe | Immigrants from Japan |
| Minimum | 76.3% | 79.1% |
| Maximum | 100.0% | 100.0% |
| Range | 23.7% | 20.9% |
| Mean | 97.5% | 97.4% |
| Median | 98.8% | 98.1% |
| Interquartile 25% (IQ1) | 97.2% | 96.7% |
| Interquartile 75% (IQ3) | 100.0% | 100.0% |
| Interquartile Range (IQR) | 2.8% | 3.3% |
| Standard Deviation (Sample) | 4.1% | 3.5% |
| Standard Deviation (Population) | 4.0% | 3.4% |
Similar Demographics by 9th Grade
Demographics Similar to Immigrants from Northern Europe by 9th Grade
In terms of 9th grade, the demographic groups most similar to Immigrants from Northern Europe are Serbian (96.0%, a difference of 0.0%), Celtic (96.0%, a difference of 0.010%), Greek (96.0%, a difference of 0.020%), Austrian (96.0%, a difference of 0.020%), and Russian (96.0%, a difference of 0.030%).
| Demographics | Rating | Rank | 9th Grade |
| Alaska Natives | 99.9 /100 | #44 | Exceptional 96.1% |
| Crow | 99.9 /100 | #45 | Exceptional 96.1% |
| Immigrants | India | 99.9 /100 | #46 | Exceptional 96.1% |
| Russians | 99.9 /100 | #47 | Exceptional 96.0% |
| Australians | 99.9 /100 | #48 | Exceptional 96.0% |
| Greeks | 99.9 /100 | #49 | Exceptional 96.0% |
| Celtics | 99.9 /100 | #50 | Exceptional 96.0% |
| Immigrants | Northern Europe | 99.9 /100 | #51 | Exceptional 96.0% |
| Serbians | 99.9 /100 | #52 | Exceptional 96.0% |
| Austrians | 99.8 /100 | #53 | Exceptional 96.0% |
| Immigrants | Canada | 99.8 /100 | #54 | Exceptional 96.0% |
| Immigrants | Austria | 99.8 /100 | #55 | Exceptional 96.0% |
| Immigrants | North America | 99.8 /100 | #56 | Exceptional 96.0% |
| Macedonians | 99.8 /100 | #57 | Exceptional 96.0% |
| Aleuts | 99.8 /100 | #58 | Exceptional 96.0% |
Demographics Similar to Immigrants from Japan by 9th Grade
In terms of 9th grade, the demographic groups most similar to Immigrants from Japan are Menominee (95.6%, a difference of 0.0%), Delaware (95.6%, a difference of 0.010%), American (95.6%, a difference of 0.020%), Filipino (95.6%, a difference of 0.020%), and Lebanese (95.6%, a difference of 0.020%).
| Demographics | Rating | Rank | 9th Grade |
| Creek | 98.8 /100 | #91 | Exceptional 95.6% |
| Immigrants | Saudi Arabia | 98.8 /100 | #92 | Exceptional 95.6% |
| Immigrants | Germany | 98.7 /100 | #93 | Exceptional 95.6% |
| Immigrants | Latvia | 98.7 /100 | #94 | Exceptional 95.6% |
| Americans | 98.5 /100 | #95 | Exceptional 95.6% |
| Filipinos | 98.5 /100 | #96 | Exceptional 95.6% |
| Delaware | 98.4 /100 | #97 | Exceptional 95.6% |
| Immigrants | Japan | 98.4 /100 | #98 | Exceptional 95.6% |
| Menominee | 98.3 /100 | #99 | Exceptional 95.6% |
| Lebanese | 98.1 /100 | #100 | Exceptional 95.6% |
| Immigrants | Moldova | 97.9 /100 | #101 | Exceptional 95.5% |
| Immigrants | Switzerland | 97.7 /100 | #102 | Exceptional 95.5% |
| Potawatomi | 97.7 /100 | #103 | Exceptional 95.5% |
| Syrians | 97.4 /100 | #104 | Exceptional 95.5% |
| Immigrants | France | 97.4 /100 | #105 | Exceptional 95.5% |