Immigrants from Israel vs Turkish 4th Grade
COMPARE
Immigrants from Israel
Turkish
4th Grade
4th Grade Comparison
Immigrants from Israel
Turks
97.6%
4TH GRADE
77.7/ 100
METRIC RATING
150th/ 347
METRIC RANK
97.9%
4TH GRADE
98.2/ 100
METRIC RATING
99th/ 347
METRIC RANK
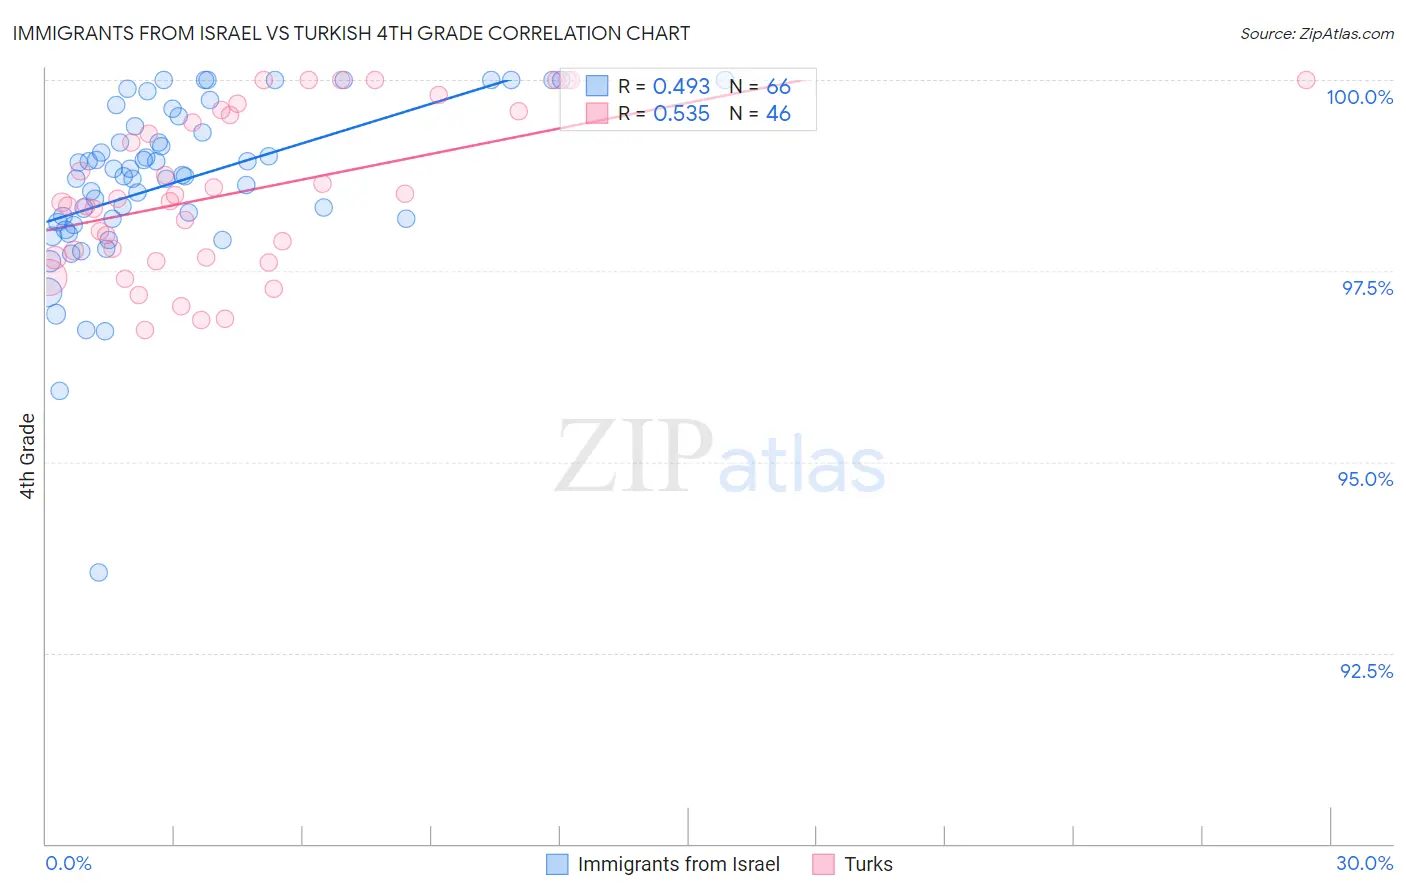
Immigrants from Israel vs Turkish 4th Grade Correlation Chart
The statistical analysis conducted on geographies consisting of 210,029,773 people shows a moderate positive correlation between the proportion of Immigrants from Israel and percentage of population with at least 4th grade education in the United States with a correlation coefficient (R) of 0.493 and weighted average of 97.6%. Similarly, the statistical analysis conducted on geographies consisting of 271,858,657 people shows a substantial positive correlation between the proportion of Turks and percentage of population with at least 4th grade education in the United States with a correlation coefficient (R) of 0.535 and weighted average of 97.9%, a difference of 0.26%.
4th Grade Correlation Summary
| Measurement | Immigrants from Israel | Turkish |
| Minimum | 93.6% | 96.7% |
| Maximum | 100.0% | 100.0% |
| Range | 6.4% | 3.3% |
| Mean | 98.7% | 98.5% |
| Median | 98.8% | 98.4% |
| Interquartile 25% (IQ1) | 98.1% | 97.7% |
| Interquartile 75% (IQ3) | 99.4% | 99.6% |
| Interquartile Range (IQR) | 1.2% | 1.9% |
| Standard Deviation (Sample) | 1.1% | 1.0% |
| Standard Deviation (Population) | 1.1% | 1.0% |
Similar Demographics by 4th Grade
Demographics Similar to Immigrants from Israel by 4th Grade
In terms of 4th grade, the demographic groups most similar to Immigrants from Israel are Soviet Union (97.6%, a difference of 0.0%), Alsatian (97.6%, a difference of 0.0%), Immigrants from South Central Asia (97.6%, a difference of 0.010%), Jordanian (97.7%, a difference of 0.020%), and Ute (97.7%, a difference of 0.020%).
| Demographics | Rating | Rank | 4th Grade |
| Burmese | 82.8 /100 | #143 | Excellent 97.7% |
| Spaniards | 82.7 /100 | #144 | Excellent 97.7% |
| Immigrants | Moldova | 82.4 /100 | #145 | Excellent 97.7% |
| Jordanians | 81.3 /100 | #146 | Excellent 97.7% |
| Ute | 80.6 /100 | #147 | Excellent 97.7% |
| Hopi | 80.6 /100 | #148 | Excellent 97.7% |
| Soviet Union | 77.8 /100 | #149 | Good 97.6% |
| Immigrants | Israel | 77.7 /100 | #150 | Good 97.6% |
| Alsatians | 77.2 /100 | #151 | Good 97.6% |
| Immigrants | South Central Asia | 76.2 /100 | #152 | Good 97.6% |
| Immigrants | Eastern Europe | 71.3 /100 | #153 | Good 97.6% |
| Immigrants | Russia | 67.0 /100 | #154 | Good 97.6% |
| Albanians | 67.0 /100 | #155 | Good 97.6% |
| Immigrants | Jordan | 66.9 /100 | #156 | Good 97.6% |
| Immigrants | Bosnia and Herzegovina | 66.0 /100 | #157 | Good 97.6% |
Demographics Similar to Turks by 4th Grade
In terms of 4th grade, the demographic groups most similar to Turks are South African (97.9%, a difference of 0.0%), Yugoslavian (97.9%, a difference of 0.0%), Romanian (97.9%, a difference of 0.010%), Cheyenne (97.9%, a difference of 0.010%), and Cree (97.9%, a difference of 0.010%).
| Demographics | Rating | Rank | 4th Grade |
| Immigrants | Western Europe | 98.7 /100 | #92 | Exceptional 97.9% |
| Immigrants | Ireland | 98.7 /100 | #93 | Exceptional 97.9% |
| Shoshone | 98.7 /100 | #94 | Exceptional 97.9% |
| Immigrants | Germany | 98.5 /100 | #95 | Exceptional 97.9% |
| Romanians | 98.4 /100 | #96 | Exceptional 97.9% |
| Cheyenne | 98.4 /100 | #97 | Exceptional 97.9% |
| South Africans | 98.2 /100 | #98 | Exceptional 97.9% |
| Turks | 98.2 /100 | #99 | Exceptional 97.9% |
| Yugoslavians | 98.1 /100 | #100 | Exceptional 97.9% |
| Cree | 98.1 /100 | #101 | Exceptional 97.9% |
| Choctaw | 97.9 /100 | #102 | Exceptional 97.9% |
| Puget Sound Salish | 97.7 /100 | #103 | Exceptional 97.9% |
| Immigrants | Nonimmigrants | 97.5 /100 | #104 | Exceptional 97.9% |
| German Russians | 97.5 /100 | #105 | Exceptional 97.9% |
| Immigrants | Czechoslovakia | 97.5 /100 | #106 | Exceptional 97.9% |