Immigrants from Eritrea vs Immigrants from Ireland 11th Grade
COMPARE
Immigrants from Eritrea
Immigrants from Ireland
11th Grade
11th Grade Comparison
Immigrants from Eritrea
Immigrants from Ireland
91.4%
11TH GRADE
0.7/ 100
METRIC RATING
254th/ 347
METRIC RANK
94.1%
11TH GRADE
99.9/ 100
METRIC RATING
44th/ 347
METRIC RANK
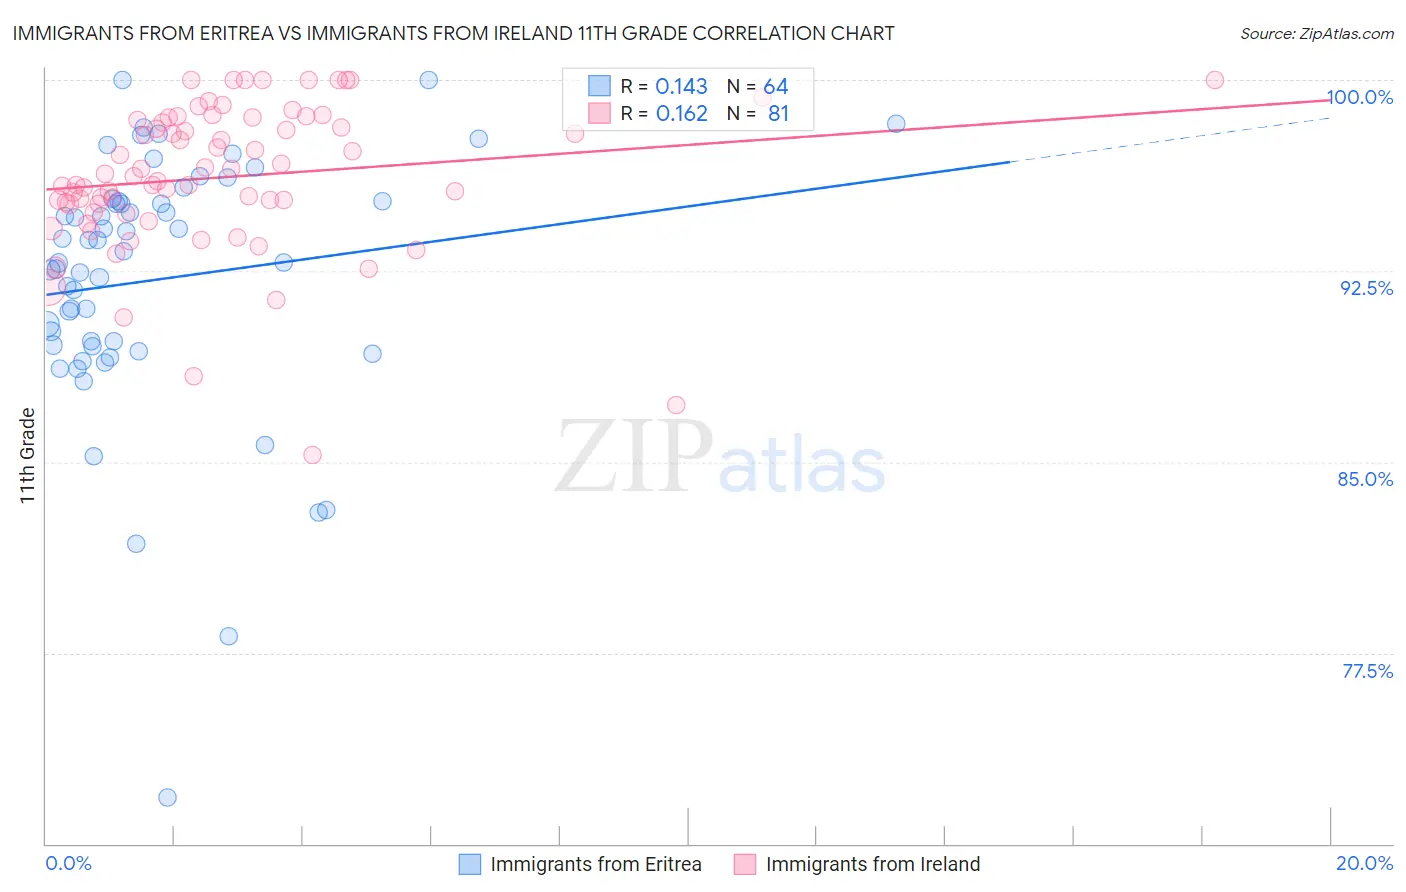
Immigrants from Eritrea vs Immigrants from Ireland 11th Grade Correlation Chart
The statistical analysis conducted on geographies consisting of 104,754,230 people shows a poor positive correlation between the proportion of Immigrants from Eritrea and percentage of population with at least 11th grade education in the United States with a correlation coefficient (R) of 0.143 and weighted average of 91.4%. Similarly, the statistical analysis conducted on geographies consisting of 240,784,498 people shows a poor positive correlation between the proportion of Immigrants from Ireland and percentage of population with at least 11th grade education in the United States with a correlation coefficient (R) of 0.162 and weighted average of 94.1%, a difference of 2.9%.
11th Grade Correlation Summary
| Measurement | Immigrants from Eritrea | Immigrants from Ireland |
| Minimum | 71.8% | 85.3% |
| Maximum | 100.0% | 100.0% |
| Range | 28.2% | 14.7% |
| Mean | 92.2% | 96.2% |
| Median | 93.1% | 96.2% |
| Interquartile 25% (IQ1) | 89.6% | 95.0% |
| Interquartile 75% (IQ3) | 95.2% | 98.5% |
| Interquartile Range (IQR) | 5.7% | 3.5% |
| Standard Deviation (Sample) | 5.1% | 2.9% |
| Standard Deviation (Population) | 5.1% | 2.9% |
Similar Demographics by 11th Grade
Demographics Similar to Immigrants from Eritrea by 11th Grade
In terms of 11th grade, the demographic groups most similar to Immigrants from Eritrea are Black/African American (91.4%, a difference of 0.010%), Immigrants from Senegal (91.4%, a difference of 0.010%), Immigrants from Nigeria (91.4%, a difference of 0.020%), Immigrants from South America (91.4%, a difference of 0.020%), and Cajun (91.4%, a difference of 0.020%).
| Demographics | Rating | Rank | 11th Grade |
| Immigrants | Philippines | 1.0 /100 | #247 | Tragic 91.5% |
| Immigrants | Uzbekistan | 1.0 /100 | #248 | Tragic 91.5% |
| Peruvians | 1.0 /100 | #249 | Tragic 91.5% |
| Ghanaians | 0.9 /100 | #250 | Tragic 91.5% |
| Immigrants | Costa Rica | 0.9 /100 | #251 | Tragic 91.4% |
| Immigrants | Nigeria | 0.8 /100 | #252 | Tragic 91.4% |
| Immigrants | South America | 0.8 /100 | #253 | Tragic 91.4% |
| Immigrants | Eritrea | 0.7 /100 | #254 | Tragic 91.4% |
| Blacks/African Americans | 0.7 /100 | #255 | Tragic 91.4% |
| Immigrants | Senegal | 0.7 /100 | #256 | Tragic 91.4% |
| Cajuns | 0.7 /100 | #257 | Tragic 91.4% |
| Immigrants | Colombia | 0.6 /100 | #258 | Tragic 91.4% |
| Jamaicans | 0.6 /100 | #259 | Tragic 91.4% |
| Spanish Americans | 0.6 /100 | #260 | Tragic 91.4% |
| Taiwanese | 0.6 /100 | #261 | Tragic 91.3% |
Demographics Similar to Immigrants from Ireland by 11th Grade
In terms of 11th grade, the demographic groups most similar to Immigrants from Ireland are Greek (94.1%, a difference of 0.010%), Australian (94.1%, a difference of 0.010%), Cypriot (94.1%, a difference of 0.020%), Immigrants from Austria (94.1%, a difference of 0.020%), and Serbian (94.1%, a difference of 0.020%).
| Demographics | Rating | Rank | 11th Grade |
| Northern Europeans | 99.9 /100 | #37 | Exceptional 94.2% |
| Hungarians | 99.9 /100 | #38 | Exceptional 94.2% |
| Immigrants | Lithuania | 99.9 /100 | #39 | Exceptional 94.1% |
| Thais | 99.9 /100 | #40 | Exceptional 94.1% |
| Cypriots | 99.9 /100 | #41 | Exceptional 94.1% |
| Immigrants | Austria | 99.9 /100 | #42 | Exceptional 94.1% |
| Greeks | 99.9 /100 | #43 | Exceptional 94.1% |
| Immigrants | Ireland | 99.9 /100 | #44 | Exceptional 94.1% |
| Australians | 99.9 /100 | #45 | Exceptional 94.1% |
| Serbians | 99.9 /100 | #46 | Exceptional 94.1% |
| Filipinos | 99.9 /100 | #47 | Exceptional 94.1% |
| Macedonians | 99.9 /100 | #48 | Exceptional 94.1% |
| Slavs | 99.9 /100 | #49 | Exceptional 94.1% |
| French | 99.9 /100 | #50 | Exceptional 94.1% |
| Turks | 99.9 /100 | #51 | Exceptional 94.0% |